
Price Economics reports:
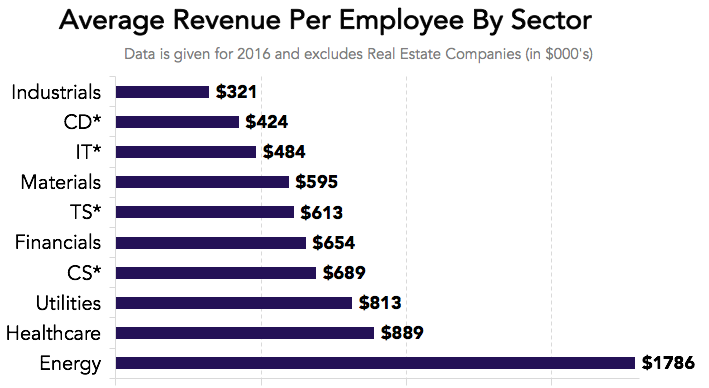
Energy companies led the pack in Revenue per Employee, followed by Healthcare and Utilities. Technology companies showed themselves to be labour-intensive with RPE at the lower end of the range, and close to Consumer Discretionaries like restaurants and hotels. Average revenue per employee in the Energy sector is double that of Healthcare companies and almost four times as high as that of Information Technology companies.
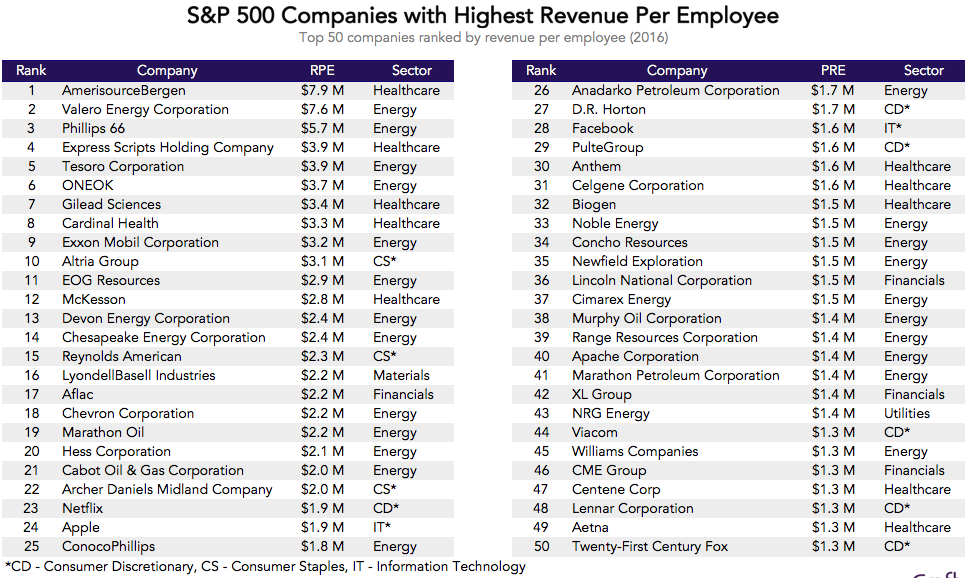
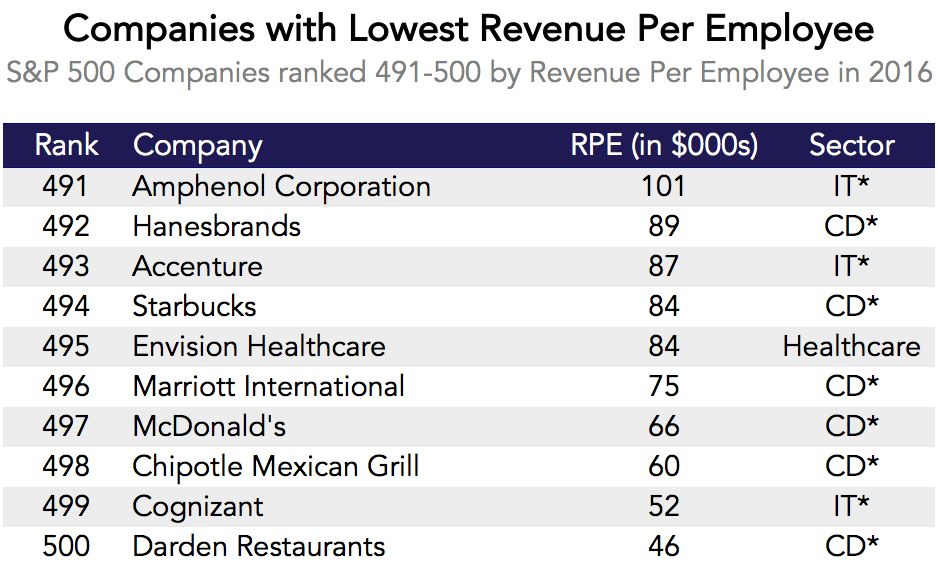
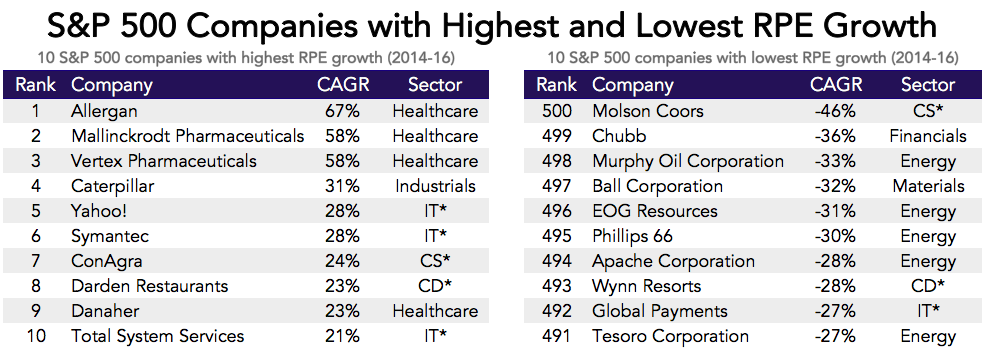
For many companies, the biggest cost is talent. This is especially true of Silicon Valley, where companies sell clicks and digital goods that do not have any material cost. So which companies' workforces are able to generate the most revenue?We decided to analyze every company in the Standard & Poor's 500 Index to see which ones had the highest and lowest revenues per employee. The Standard & Poor's 500 Index (S&P 500”) includes the 500 largest American companies listed on the NYSE or NASDAQ. In 2016, S&P 500 companies generated $11 trillion in combined revenue and employed more than 25 million people worldwide.We found that Energy companies have the highest average Revenue per Employee, while Industrials and Consumer Discretionaries perform worst on this metric.Technology companies performed at the lower end of the range on Revenue per Employee; part of the reason for this however, is other companies in spaces like Energy and Healthcare have large non-employee costs that Technology companies do not have.***The table below shows the top 50 companies by Revenue Per Employee in 2016 in S&P 500.Data source: CraftAmerisourceBergen, a pharmaceutical distributor, tops the list, generating more than $7.9M per employee in 2016. With a reported team of 19,000, which is less than half the workforce of Cardinal Health (37,300) and McKesson (68,000), the company compares favorably to its peers on revenue per employee. Cardinal Health and McKesson's RPE were $3.3M and $2.8M, respectively. Overall, Healthcare companies score well on revenue per employee, though they have other huge costs (the costs of administering drugs and health services).Energy companies Valero Energy Corporation and Phillips 66 take positions 2 and 3, with $7.6M and $5.7M in Revenue per Employee. With the exception of tobacco manufacturers (Altria Group and Reynolds American) and insurance providers (Aflac and XL Group), the top ranks are dominated by Energy and Healthcare sectors. 23 of the top 50 are Energy companies and one-fifth are Healthcare organizations. Like Healthcare companies, Energy companies also have large non-employee costs, however (the costs of the natural resources, for example)Grouping the companies into sectors in the chart below, we see the relative labour-intensity of different industries.Data source: CraftAverage revenue per employee in the Energy sector is double that of Healthcare companies and almost four times as high as that of Information Technology companies.The table below shows the lowest 10 companies in the index ranked by RPE.Data source: CraftIt is perhaps unsurprising that Restaurant and Hotel chains make up the majority of the list. What is more striking is that IT providers Cognizant and Accenture have among the lowest revenue per employee in the Index.Amphenol Corporation, a manufacturer of interconnect products, recorded $101K Revenue per Employee, less productive than its competitor TE Connectivity, which generated $163K per Employee.***Next, we calculated the change in Revenue per Employee from 2014-16 to see if any trends emerged. The graph below shows S&P 500 companies with the highest and lowest growth rate in RPE.Data source: CraftMost of the RPE growth leaders made headcount reductions last year and thus saw their sales per headcount increase. The healthcare companies in this list with an exception for Vertex Pharmaceuticals experienced both revenue growth and headcount reduction, leading to sharp growth in RPE.8 out of 10 companies with the lowest RPE growth experienced a drop in revenues in the period, while remaining Ball Corporation and Global Payments shrank in RPE mainly due to extensive recruiting.***We then looked specifically at Technology companies. Only Netflix (which is classed as Consumer Discretionary in the S&P500, not Technology), Apple and Facebook appeared among the top 50 companies by RPE, which required RPE of at least $1.3M.The following table shows the top 20 Technology companies by revenue, ranked by RPE.Data source: CraftApple has the highest revenue per employee in this selection of technology companies. However, they have substantial non-employee costs since selling hardware involves buying materials and making something tangible. Facebook and Alphabet (Google), on the other hand, make most of their revenue from selling a virtual good (advertising) and still have a tremendously high revenue per employee. VeriSign, which provides domain names and internet security, was a strong performer, generating $1.1Bn in revenue from only 990 employees, ranking fourth in the Technology sector, with $1.2M per employee.***Overall, Energy companies led the pack in Revenue per Employee, followed by Healthcare and Utilities. Technology companies showed themselves to be labour-intensive with RPE at the lower end of the range, and close to Consumer Discretionaries like restaurants and hotels. To see the full list of companies comprising S&P 500 Index, please click here.


0 comments:
Post a Comment