Why Population Density and Income Determines Where People Own Cars - Or Not
Increasingly - and especially in tech-centric urban areas - car ownership is losing its value as an emblem of economic status. JL
Henry Grabar reports in Slate:
Does income still determine car ownership in this country? Or is
car ownership beginning to more closely conform to population density, in which “a developed country is one in which the rich
use public transportation”? The answer is, that it depends where you live.: In many cities, walkable and transit-accessible real estate commands prices so high that not driving has become a privilege. For the first time, high-income young people drive less than low-income young people.
Nobody owns more cars than Americans do. According to the U.S. Department of Transportation, there were 248 million light-duty vehicles on the roads in 2016, or about 0.77 cars per person. For most of the postwar era, it was clear that car ownership signified status. Now things are a little more complicated: In many cities, walkable and transit-accessible real estate commands prices so high that not driving has become a privilege. For the first time, high-income young people drive less than low-income young people. Uber, Lyft, and smartphones have stripped the friction from carless life.
So does income still determine car ownership in this country? Or is car ownership beginning to more closely conform to population density, according to the famous prediction of former Bogotá, Colombia, Mayor Enrique Peñalosa, in which “a developed country is one in which the rich use public transportation”?
The answer is, naturally, that it depends where you live. A few weeks ago, I asked Trulia chief economist Issi Romem if he could plot American car ownership at the local level. On Thursday, he published a dataset that shows “persons per vehicle” by metro area and by ZIP code, and compares those statistics to income and population density. The findings sit right at the heart of the debate about the Green New Deal and the role of the automobile in American life, where driving is at once a source of so much harm and an absolute requirement for participating in the labor force.
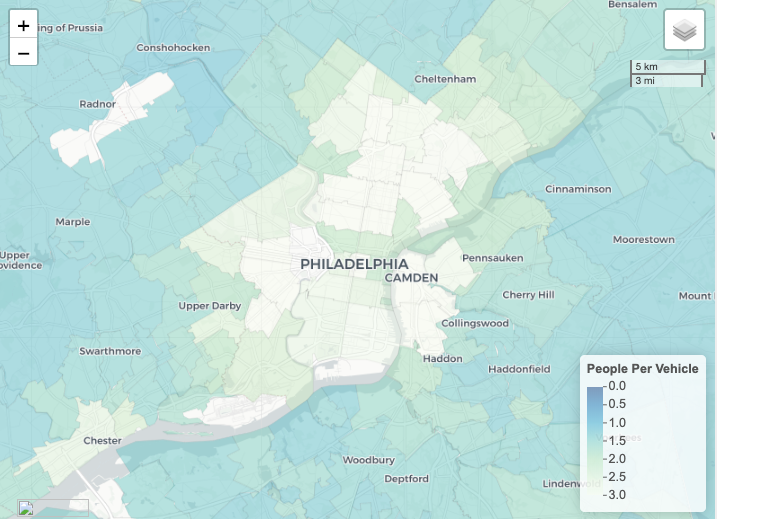
Philadelphia mapped by per capita car ownership.
Issi Romem/Trulia
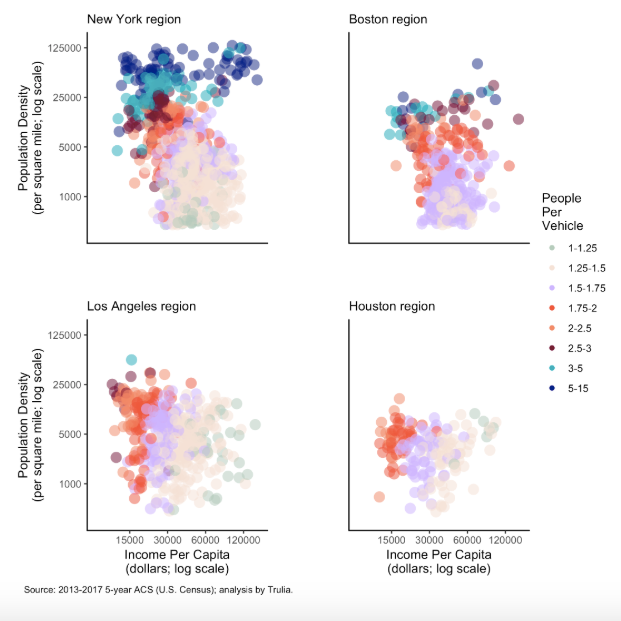
Here’s what Romem found: In dense, transit-rich cities like New York and Boston, vehicle ownership is more closely linked to population density than to income. What kind of neighborhood you live in is likely to align with whether you own a car, or two. In places like Los Angeles and Houston, vehicle ownership is much more closely tied to income. Families who make more money buy more cars.
Horizontal patterns in New York and Boston indicate vehicle ownership sorted by population density. Vertical patterns in Los Angeles and Houston indicate vehicle ownership sorted by income.
Issi Romem/Trulia
In the graph above, you can see how ZIP codes with similar car ownership rates (darker = fewer cars; lighter = more cars) line up horizontally on the graphs for New York and Boston—i.e., are sorted according to neighborhood population density. In Los Angeles and Houston (and most other cities), ZIP codes are grouped into vertical stripes—i.e., are sorted by per capita income.
Weirdly, Boston and Los Angeles have similar population density. The difference? Probably that Boston has 28 percent of its jobs within three miles of downtown—the fifth-highest job concentration among big U.S. metros. In Los Angeles, that figure is 8 percent—good for the fourth-lowest concentration of jobs.
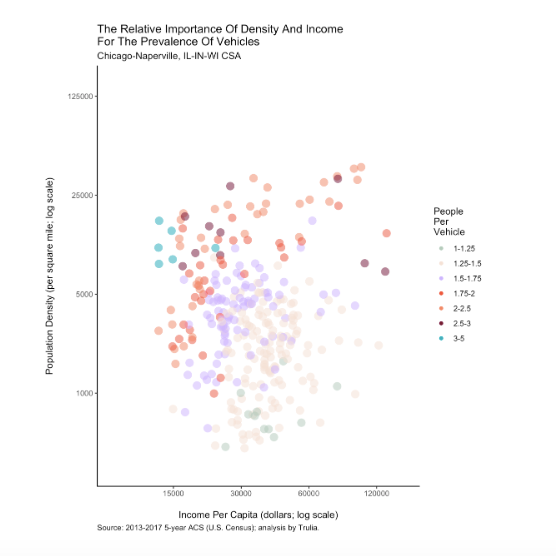
Some cities have a little of both. In Chicago (below), the ZIP codes with the lowest vehicle ownership rates are all very poor. But in the next lowest tier, you can see how the red and orange dots (indicating areas with 1.75 to 2.5 people per vehicle) form a rotated L-shape—a vertical line for low-income ZIP codes and a horizontal line for high-density ZIP codes.
Chicago displays both horizontal (population density) and vertical (income) sorting in car ownership rates.
Issi Romem/Trulia
On average, Romem finds, rising income and falling population density have approximately the same positive correlation with car ownership.
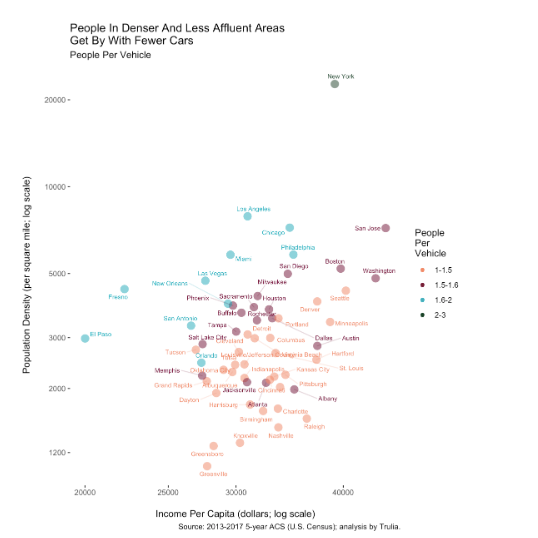
Comparing cities, the findings are a little more complicated. Links among low ownership, low income, and high density persist, but a new tier of cities jumps forward. These are poorer cities with large populations of immigrants and young people—metros like Las Vegas, El Paso, San Antonio, Orlando, and Fresno. All have lower car ownership than denser, wealthier metros like D.C. and Boston. You can explore other cities at Trulia, or download the dataset for metro areas.
Metro areas colored by car ownership rates; plotted by income and population density.
Issi Romem/Trulia
Back to policy. As an environmental project, any flagship Democratic legislation should aim to remove as many cars from the road as possible. (Cars are the nation’s No. 1 source of greenhouse gas emissions, and the localized air pollution effects in poor neighborhoods are particularly harmful.) But if the Green New Deal is a pure social justice project, it should probably just give poor people cars, because access to efficient transportation is the most effective predictor of escaping poverty, auto loans make up the fastest-growing segment of consumer debt profiles, and sprawl makes it challenging to provide good public transport.
How do we square that circle? By redesigning cities so that driving—and by extension, car ownership—can be a choice and not, as the U.S. Supreme Court has put it, a “virtual necessity.” That would be good for the environment, good for low-income people, good for the mobility of seniors who shouldn’t get behind the wheel, and good for the 100 million Americans who are not licensed to drive, a number that includes children, undocumented immigrants, and the disabled.
What Romem’s dataset offers is a map of which neighborhoods in which cities have succeeded in crossing that bridge to a place where the wealthy don’t own cars—an indicator that vehicle ownership, in those places, is a choice. We can try to build more cities like these, where jobs are accessible by fast, frequent transit and housing is dense enough to support walkable amenities. Or we can make it possible for more people to live in the neighborhoods that have gotten something right.
As a Partner and Co-Founder of Predictiv and PredictivAsia, Jon specializes in management performance and organizational effectiveness for both domestic and international clients. He is an editor and author whose works include Invisible Advantage: How Intangilbles are Driving Business Performance. Learn more...


0 comments:
Post a Comment