Josh Marshall reports in Talking Points Memo:
The overlap of lockdown to peak fatalities and infections is important for understanding the duration of outbreaks. Italy’s fatalities peaked on March 27th. Italy shutdown from March 8th-10th. So there were 19 days from the imposition of dramatic social distancing/lockdown and the peak of fatalities. This is very close to the pattern in Wuhan, China, where there were 20 days between the lockdown of the city of Wuhan on January 23rd and the mortality peak on February 12th. If April 4th (was) the peak of daily fatalities in New York, 19 days before would be Monday, March 16th. That was the first day of school closures in New York City.
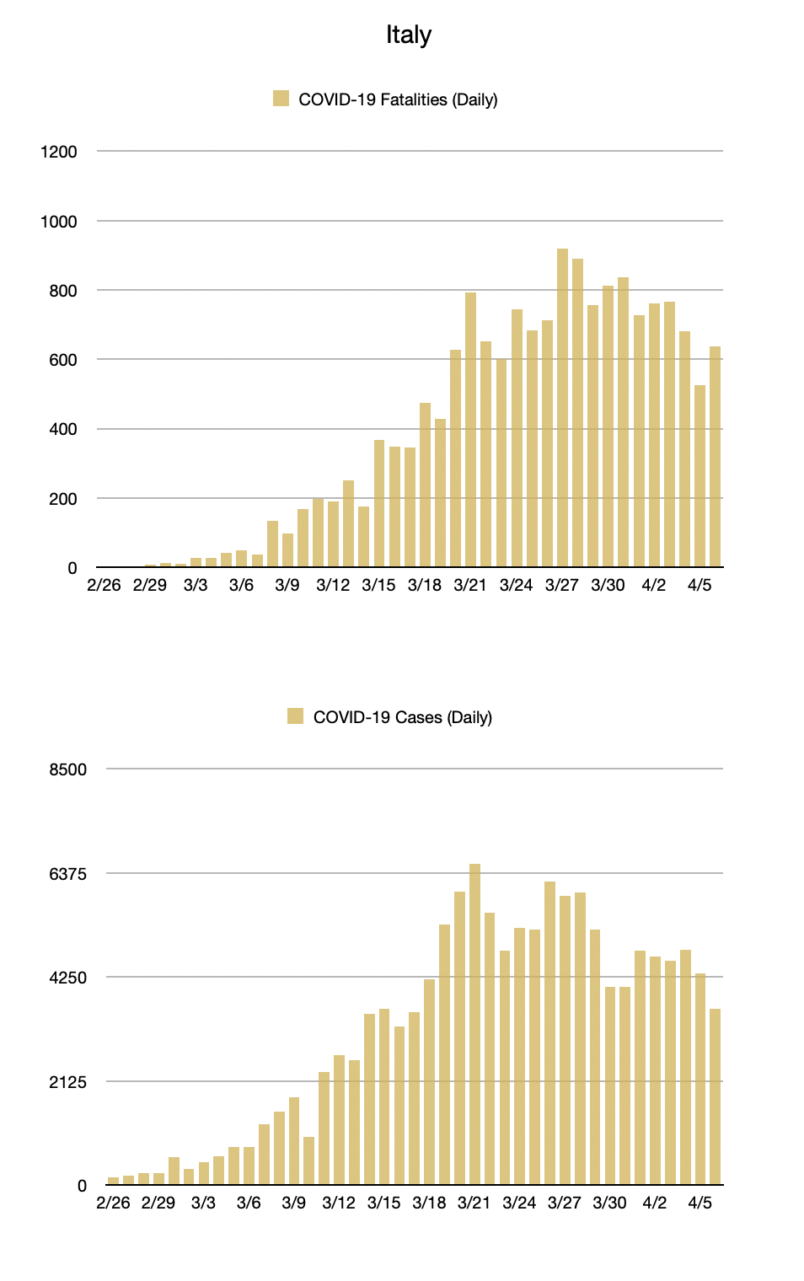
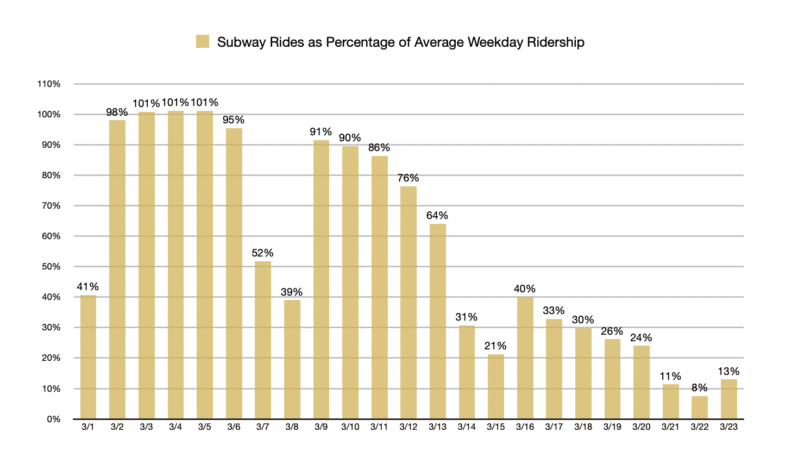
There’s some very tentative information today that New York may be nearing the peak of its outbreak. I want to emphasize very tentative. If we go by the progression in the hardest hit countries in Europe, even if this is at or near the peak we are likely to see more days where numbers spike again. And I will finally say that there has been evidence of some numbers slowing over weekends. With all that, the number of fatalities in New York was lower yesterday and today than it was on Saturday when it hit 630. The number of new hospitalizations has also slowed while discharges have risen. There’s also some evidence of decline in new cases. But, as we’ve discussed, this can simply be an echo of testing constraints. We can finally note that before its revisions yesterday, the IHME COVID-19 model had predicted that New York would hit its peak on April 6th.If this does turn out to be the plateau of the epidemic in New York I want to share some information about dates and how they compare with the remarkably consistent pattern from China and Italy.To provide some context, let’s look at Italy where the epidemic has clearly crested, albeit maintaining itself still at a brutal level of more than five hundred fatalities per day.We can now see that Italy’s reported fatalities peaked on March 27th when 919 people died from the disease. Italy shutdown with a rolling series of actions from March 8th-10th. The lockdown in Lombardy was announced on March 8th. So there were 19 days from the imposition of dramatic social distancing/lockdown and the peak of fatalities. Notably, this is very close to the pattern in Wuhan, China, where there were 20 days between the lockdown of the city of Wuhan on January 23rd and the mortality peak on February 12th. (There were slightly more fatalities recorded on February 23rd. But that was because of a change in manner of diagnosis.) The two regions were also one day apart on peak reported infections.If April 4th does to turn out to be the peak of daily fatalities in New York, 19 days before would be Monday, March 16th. So let’s look at what was happening on that and surrounding days. That was the first day of school closures in New York City and one day after Mayor Bill DeBlasio announced the closure on March 15th. As we noted at the time, we saw anecdotal accounts from around the country that school closures – whatever their impact directly – were the key social signal of crisis and a dramatic change in behavior in cities and regions around the country.Gov. Cuomo’s “pause” (New York’s version of shelter in place) was announced on March 20th and went fully into effect on the 22nd. So that is another key date.We can also see the progress of the lockdown of New York City, the epicenter of the outbreak from daily subway ridership, which fell from 91% to 24% of normal ridership over the second and third weeks of the month.Let me reiterate that we don’t know New York is at its peak. But we are seeing some evidence of it. The remarkable overlap of lockdown to peak fatalities and infections in Italy and China is also important for understanding the duration of outbreaks in other regions.


0 comments:
Post a Comment