Algorithm Estimates That Covid Infections Are 3X Higher Than Reported
Who ya gonna trust: the algorithm or your lying eyes?
Thomas Macaulay reports in The Next Web:
The model makes daily predictions of both total and current infections
across the US and in the 50 countries worst affected by the virus. It calculated that more than 71 million people in the US had contracted COVID-19 by February 4, when there were only 26.7 million confirmed cases. In other countries, the algorithm also calculated far higher numbers of
infections than those reported. In the UK, it calculated that there were
nearly 25 million — rather than around 4 million confirmed cases —
while in Mexico, it predicted that there were almost 27.6 million
instead of 1.9 million.
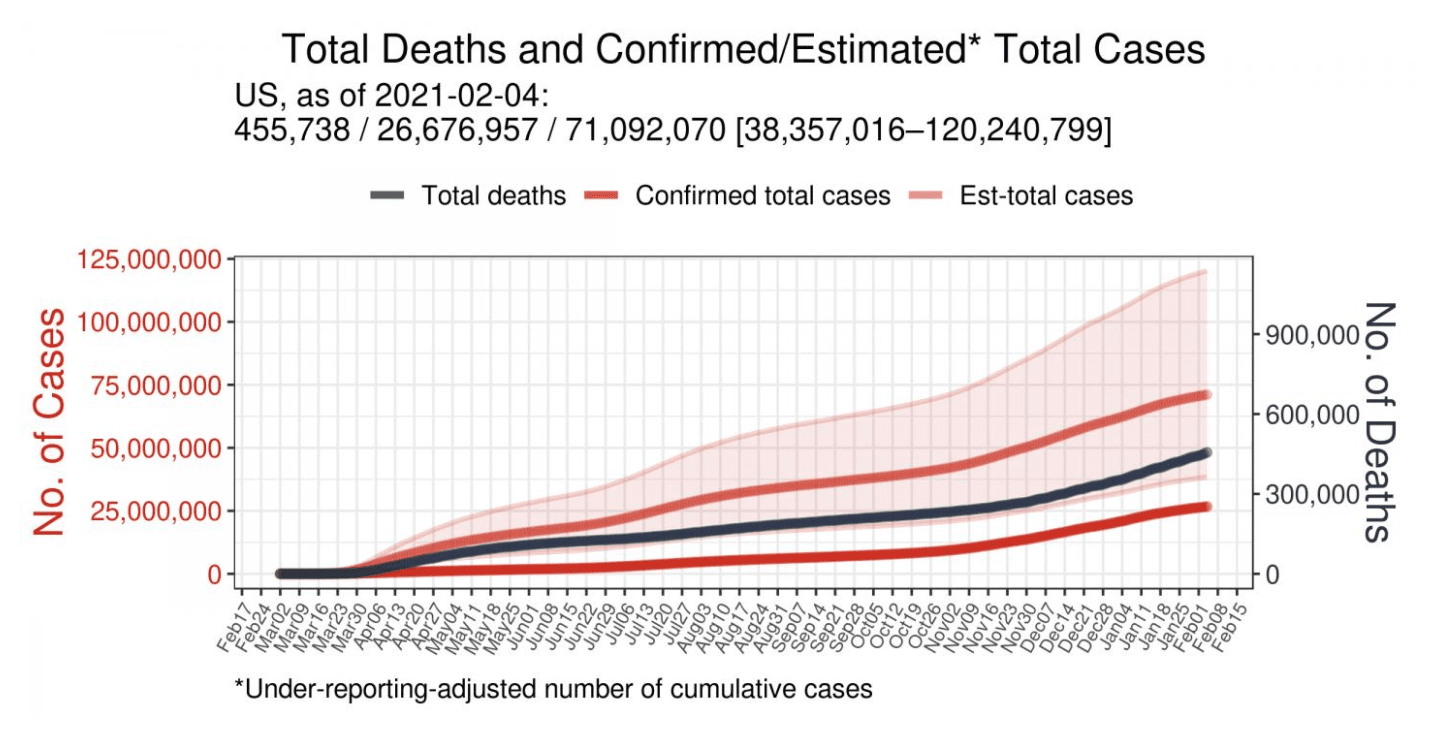
An algorithm developed at the UT Southwestern medical center has estimated that there are almost three times as many COVID-19 infections in the US than the number of confirmed cases.
The model makes daily predictions of both total and current infections across the US and in the 50 countries worst affected by the virus.
It calculated that more than 71 million people in the US had contracted COVID-19 by February 4, when there were only 26.7 million confirmed cases.
The model also estimated that 7 million people in the country currently have infections and are potentially contagious.
In other countries, the algorithm also calculated far higher numbers of infections than those reported. In the UK, it calculated that there were nearly 25 million — rather than around 4 million confirmed cases — while in Mexico, it predicted that there were almost 27.6 million instead of 1.9 million.
“The estimates of actual infections reveal for the first time the true severity of COVID-19 across the U.S. and in countries worldwide,” said study author Jungsik Noh ina statement.
Credit: Jungsik Noh via GitHubThe shaded area of the estimates represents the possible range of cumulative cases.
The algorithm’s calculations are derived from the number of reported deaths, rather than the amount of lab-confirmed cases.
It then assumes that the infection fatality rate is 0.66%, based on earlypandemic data in China.
It also examines other factors, such as the average days it takes for someone with symptoms to either die or recover.
Finally, it compares its predictions with the number of publicly-reported cases to calculate a ratio of confirmed-to-estimated infections.
Noh compared his early findings with existing prevalence rates found in studies that used blood tests to check for antibodies to the SARS-CoV-2 virus.
He found that the algorithm’s estimates closely corresponded to the percentage of people who tested positive for antibodies.
Noh admits that the estimates are rough, due to the uncertainty of factors such as the COVID-19 death rate. Nonetheless, he says they’re more accurate than the confirmed cases used to guide public health policies:
Knowing the true severity in different regions will help us effectively fight against the virus spreading. The currently infected population is the cause of future infections and deaths. Its actual size in a region is a crucial variable required when determining the severity of COVID-19 and building strategies against regional outbreaks.
As a Partner and Co-Founder of Predictiv and PredictivAsia, Jon specializes in management performance and organizational effectiveness for both domestic and international clients. He is an editor and author whose works include Invisible Advantage: How Intangilbles are Driving Business Performance. Learn more...


0 comments:
Post a Comment