
There are also health recordkeeping issues in many countries. But the primary reason for the Covid death undercount which is estimated to be half of the real number, is political. Countries do not want to admit they did such a poor job of handling the virus. Among the most egregious undercounts are: India, Brazil, Russia, Brazil and the US. JL
Johns Hopkins Bloomberg Institute for Global Health and the University of Washington Institute for Health Metrics and Evaluation report:
Global COVID-19 deaths are more than twice as high as official estimates, according to a new University of Washington Institute for Health Metrics and Evaluation analysis that raises the death toll to more than 6.9 million.Why the vast undercount? Limited testing capacity in many countries is a key reason, but it doesn’t explain why only a fraction of COVID-19 deaths are being reported in some countries.
Hopkins Global COVID-19 deaths are more than twice as high as official estimates, according to a new University of Washington Institute for Health Metrics and Evaluation analysis that raises the death toll to more than 6.9 million.
Why the vast undercount? Limited testing capacity in many countries is a key reason, but it doesn’t explain why only a fraction of COVID-19 deaths are being reported in some countries.
- IHME estimates Russia had more than 593,000 deaths as of May 3, while only 109,334 had been officially reported.
- Likewise, deaths in Mexico were calculated to be nearly 494,000 and not 174,000.
- IHME’s analysis shows that that wealthy countries, too, have severe undercounts at least partly because of COVID-19 deaths that went unattributed in the pandemic’s early days:
- The US has had 905,289 COVID-19 deaths as of May 3, far above the official number of 574,073.
- Germany’s death toll is 120,079—45% higher than the official number.
- The Quote: “…Covid is going to rival Spanish flu at the global level in terms of the count, likely, before we see the end of this epidemic,” IHME director Christopher Murray told STAT reporter Helen Branswell and others. 675,000 Americans were believed to have died in the 1918 pandemic.
- Case in Point: India When a local newspaper in Rajkot published 240 obituaries on a late April day, the official death count for the city and its surrounding district was 12, The Washington Post reports.
- Post reporters comparing crematorium statistics in 3 Indian cities to official counts found only a fraction of deaths were being reported.
UW In the IHME estimation of COVID-19 infections, hospitalizations, and deaths to date, we have used officially reported COVID-19 deaths for nearly all locations. As of today, we are switching to a new approach that relies on the estimation of total mortality due to COVID-19. There are several reasons that have led us to adopt this new approach. These reasons include the fact that testing capacity varies markedly across countries and within countries over time, which means that the reported COVID-19 deaths as a proportion of all deaths due to COVID-19 also vary markedly across countries and within countries over time. In addition, in many high-income countries, deaths from COVID-19 in older individuals, especially in long-term care facilities, went unrecorded in the first few months of the pandemic. In other countries, such as Ecuador, Peru, and the Russian Federation, the discrepancy between reported deaths and analyses of death rates compared to expected death rates, sometimes referred to as “excess mortality,” suggests that the total COVID-19 death rate is many multiples larger than official reports. Estimating the total COVID-19 death rate is important both for modeling the transmission dynamics of the disease to make better forecasts, and also for understanding the drivers of larger and smaller epidemics across different countries.
Our approach to estimating the total COVID-19 death rate is based on measurement of the excess death rate during the pandemic week by week compared to what would have been expected based on past trends and seasonality. However, the excess death rate does not equal the total COVID-19 death rate. Excess mortality is influenced by six drivers of all-cause mortality that relate to the pandemic and the social distancing mandates that came with the pandemic. These six drivers are: a) the total COVID-19 death rate, that is, all deaths directly related to COVID-19 infection; b) the increase in mortality due to needed health care being delayed or deferred during the pandemic; c) the increase in mortality due to increases in mental health disorders including depression, increased alcohol use, and increased opioid use; d) the reduction in mortality due to decreases in injuries because of general reductions in mobility associated with social distancing mandates; e) the reductions in mortality due to reduced transmission of other viruses, most notably influenza, respiratory syncytial virus, and measles; and f) the reductions in mortality due to some chronic conditions, such as cardiovascular disease and chronic respiratory disease, that occur when frail individuals who would have died from these conditions died earlier from COVID-19 instead. To correctly estimate the total COVID-19 mortality, we need to take into account all six of these drivers of change in mortality that have happened since the onset of the pandemic.
Our analysis follows four key steps. First, for all locations where weekly or monthly all-cause mortality has been reported since the start of the pandemic, we estimate how much mortality increased compared to the expected death rate. In other words, we estimate excess mortality in all locations with sufficient data. Second, based on a range of studies and consideration of other evidence, we estimate the fraction of excess mortality that is from total COVID-19 deaths as opposed to the five other drivers that influence excess mortality. Third, we build a statistical model that predicts the weekly ratio of total COVID-19 deaths to reported COVID-19 deaths based on covariates and spatial effects. Fourth, we use this statistical relationship to predict the ratio of total to reported COVID-19 deaths in places without data on total COVID-19 deaths and then multiply the reported COVID-19 deaths by this ratio to generate estimates of total COVID-19 deaths for all locations. More details on each of these analytical steps are presented below.
1. Estimating excess mortality compared to expected mortality for locations where all-cause mortality data have been reported during the pandemic
56 countries and 198 subnational units have reported either weekly or monthly deaths from all causes for parts of 2020 and for prior years. Our analysis of excess mortality follows three steps. First, we estimate expected mortality in the absence of COVID-19 based on the patterns of all-cause mortality reported in prior years; second, we subtract observed all-cause mortality from March 2020 onward from expected mortality; and third, we remove from the analysis known periods of excess mortality due to causes other than COVID-19, such as the August 2020 heat wave in many European countries. For locations where vital registration systems are not complete, we apply the adjustment to the reported death counts based on our estimated completeness from the Global Burden of Disease study.1
To estimate expected mortality, we need to account for both seasonality and the secular trend in all-cause mortality. We developed a novel method to capture the expected mortality level and trend based on past data on all-cause mortality. In this method, we estimate the typical seasonal pattern of mortality and then estimate the secular trend of all-cause mortality after correcting for the seasonal pattern. Figure 1 below shows the application of this model to all-cause mortality data by week from Denmark. By grouping data by weeks, we are able to estimate an overall seasonality pattern by week (as shown in Panel A of Figure 1). Residuals between weekly observed data and the fitted seasonality pattern are shown in Panel B and represent the time trend. We fit a spline to the residuals to estimate the time trend and then use it to extend the time trend into 2020 and to the present day. By combining the seasonal trend and the secular trend in the residuals, for each location we generate a prediction of the expected level of mortality in 2020 and 2021, as shown in the red box in Panel C of Figure 1.
Figure 1. New model for the estimation of expected mortality
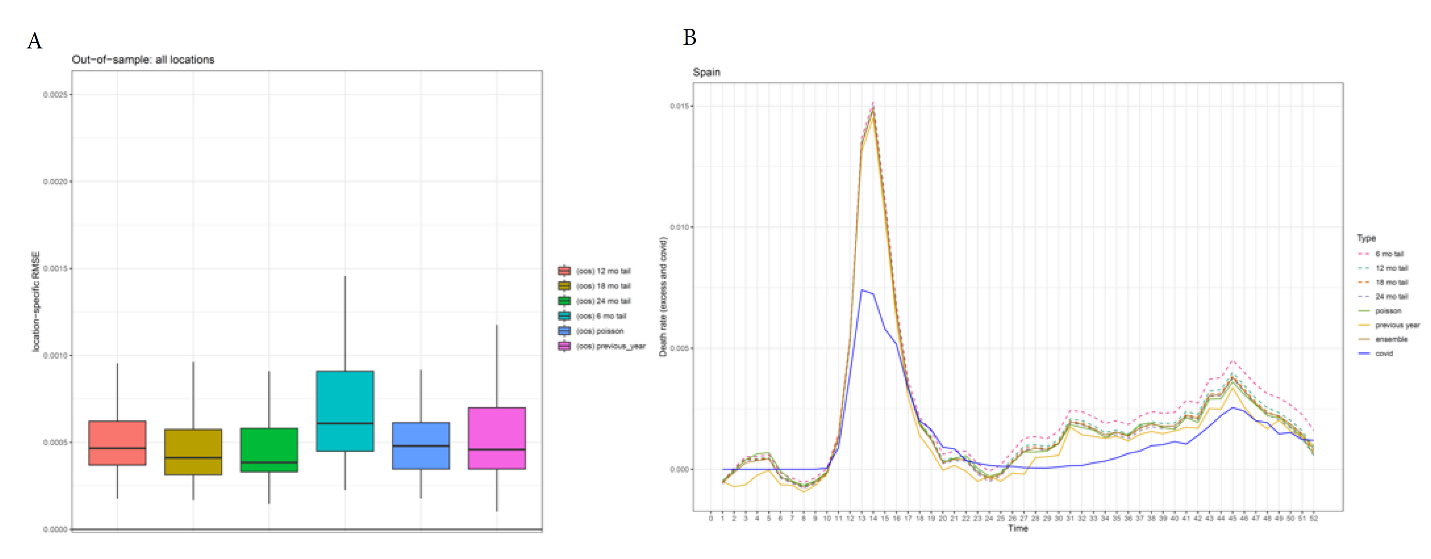
As expected, the model specification of the spline can have a sizeable impact on the estimated expected mortality. To make our results more robust to model specification, we create an ensemble of four different model specifications for the spline. In addition, we also include in the ensemble a Poisson model with fixed effects on week and year, as well as a model that assumes that the expected mortality rate for 2020 and 2021 is the same as the weekly mortality rate observed in 2019. To derive weights for the different models in the ensemble, we examined how each model performed out of sample. We fit the model to all data prior to 2019 and then evaluate how each model performed in predicting mortality levels in 2019 compared to observed mortality in 2019. We then use the root mean squared error (RMSE) of the predictions for 2019 to derive weights for each of the component models in the ensemble. Figure 2A shows the distribution of RMSE by location for each of six models included in the model ensemble. Figure 2B shows the estimated excess mortality, which is the difference between the observed and estimated expected mortality, for each component model and for the ensemble for Spain.
Figure 2. Estimation of excess mortality, an ensemble approach
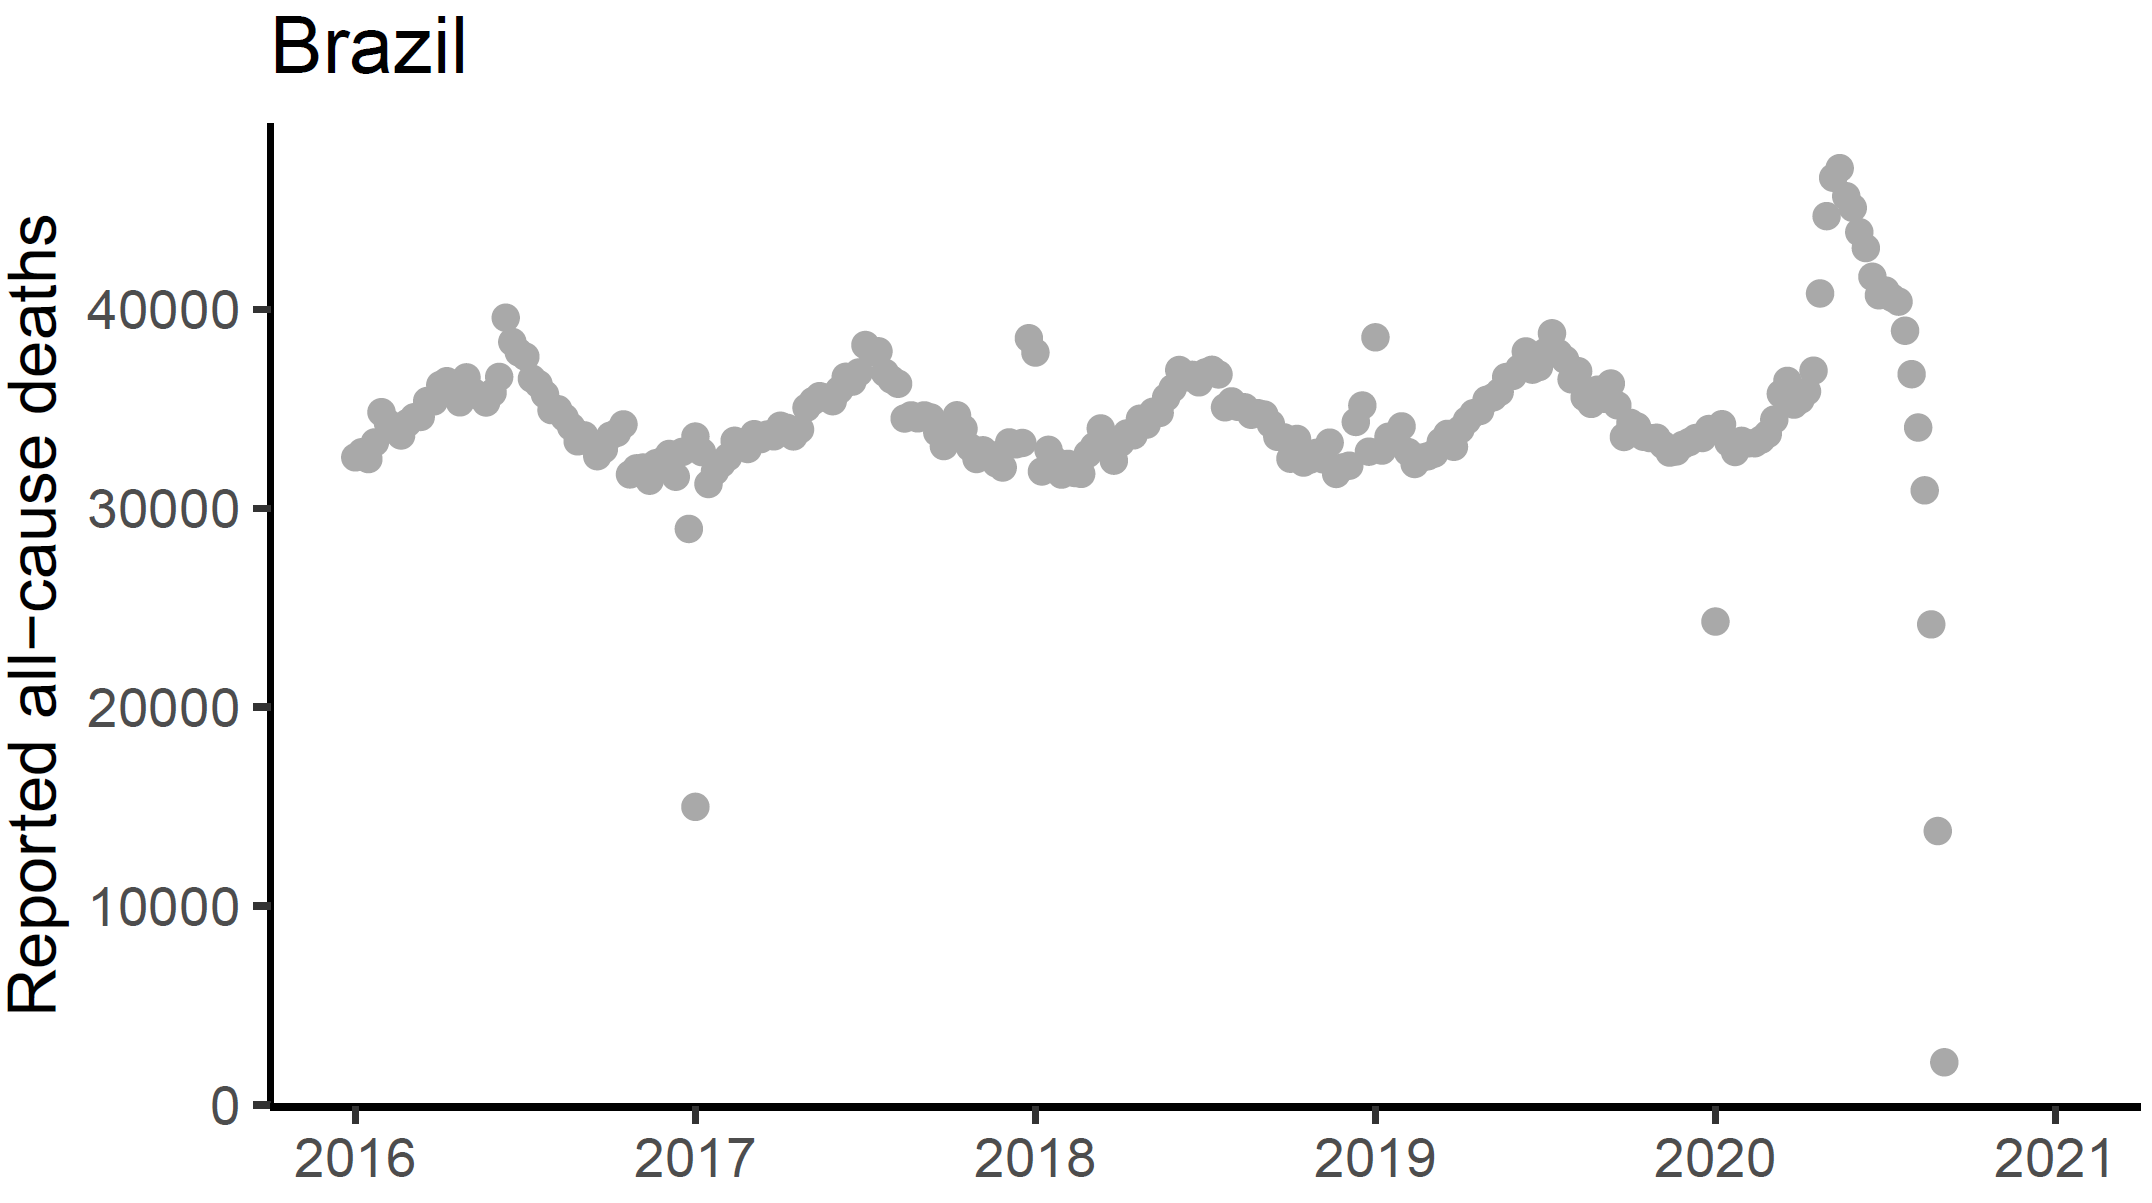
For each location, we then compared the estimate of excess mortality by week (or month, depending on the data) with reported COVID-19 deaths. This revealed two types of data issues. First, in many European countries there was a spike of excess deaths in weeks 31–35 during a period when COVID-19 reported deaths were extremely low. This period coincided with a heat wave and national reports of deaths due to the heat wave. We excluded these weeks of data from subsequent analyses. Another type of data anomaly was related to lags in the reported all-cause mortality. As an example, Figure 3 shows the lags in the reported all-cause mortality from the vital registration system in Brazil. There is clear and significant late registration of deaths since June 2020. In this case, we have marked the 2020 vital registration data from Brazil as outliers and opted to use data from the civil registration system (source link). We systematically reviewed the input vital registration data and trimmed time periods that are likely be subjected to late registration for all locations in the analysis.
Figure 3. Reported all-cause deaths for Brazil
2. Estimating the fraction of excess mortality that is direct COVID-19 deaths
As noted above, excess mortality is a function of six potential drivers, the most important of which is the total COVID-19 death rate. Deaths that are directly due to COVID-19 are likely underreported in many locations, particularly in settings where COVID-19 testing is in short supply. Most excess mortality is likely misclassified COVID-19 deaths. An analysis by the Netherlands statistical agency suggested that all excess deaths in the Netherlands were directly due to COVID-19.2 In fact, their analysis actually suggested that direct COVID-19 deaths may be higher than estimated excess deaths because deaths due to some other causes have declined during the pandemic.
The second driver of excess mortality is reduced health care utilization for many causes;3 however, the impact of reduced health care use on health outcomes is harder to prove. Many mechanisms have been proposed, including reduced vaccination rates and reduced births in hospital.4 Demonstrated increases in cause-specific mortality related to these causes, however, have not yet been verified. The impact of changes in health care utilization on excess mortality may be observed in later years, rather than in 2020 or the first quarter of 2021.
Third, convincing evidence has been found that rates of anxiety and depression have increased, which might in turn lead to increases in deaths from suicide.5 To date, the evidence on increased suicide is very limited.6 Opioid deaths, on the other hand, have clearly increased7 in the United States. Compared to past trends, opioid deaths increased by around 15,000 since March 2020. Evidence on whether this has also occurred in other countries awaits further study.
Fourth, we reviewed the evidence on decreases in injuries as a result of reductions in mobility. We analyzed data from 12 countries that provide cause of death data by week or month, which allows us to test whether some causes decreased significantly during 2020 and whether that decrease was related to the decreases in mobility that have been reported. This analysis suggests that globally, injury mortality decreased by 5% in 2020 due to reductions in mobility. At the global level, this translates into a reduction of approximately 215,000 deaths.
Fifth, some infectious causes of death may have declined during the pandemic due to the behavioral changes associated with control of the pandemic, including mask use and reduced contact with others. Causes that have clearly declined are influenza,8,9 respiratory syncytial virus,10 measles,11 and possibly other respiratory viruses and viral diarrheas. For example, influenza cases in the United States declined 99.3% from the winter season of 2019–2020 to the winter season of 2020–2021. Combining the reductions reported in different countries in influenza, respiratory syncytial virus, and measles, the global reduction in mortality from these causes may be larger than 400,000 deaths.
Sixth, deaths from some chronic conditions such as ischemic heart disease or chronic respiratory disease declined in some months of 2020, most notably in May and June in Europe. These declines were most likely due to the fact that frail individuals who died from COVID-19 earlier in the year would otherwise likely have died from these chronic conditions. The strongest evidence for this effect is that excess mortality was negative in some countries in Europe in June when the reported COVID-19 death rate was very low. In aggregate, this effect likely reduced mortality by only 2% based on our analysis.
Overall, the evidence suggests reductions of 615,000 deaths, or potentially more, stemming from behavioral changes at the global level. The main potential increases in excess mortality due to deferred care and increases in drug overdose and depression are hard to quantify at this point or are of a much smaller magnitude. Given that there is insufficient evidence to estimate these contributions to excess mortality, for now we assume that total COVID-19 deaths equal excess mortality. For the reasons presented in this section, we believe that this is likely an underestimate. As the evidence is strengthened in the coming months and years, it is likely that we will revise our estimates of the total COVID-19 death rate upward in future iterations of this work, once we can properly take into account the drivers described in this section.
3. Estimating the ratio of excess mortality to reported COVID-19 deaths
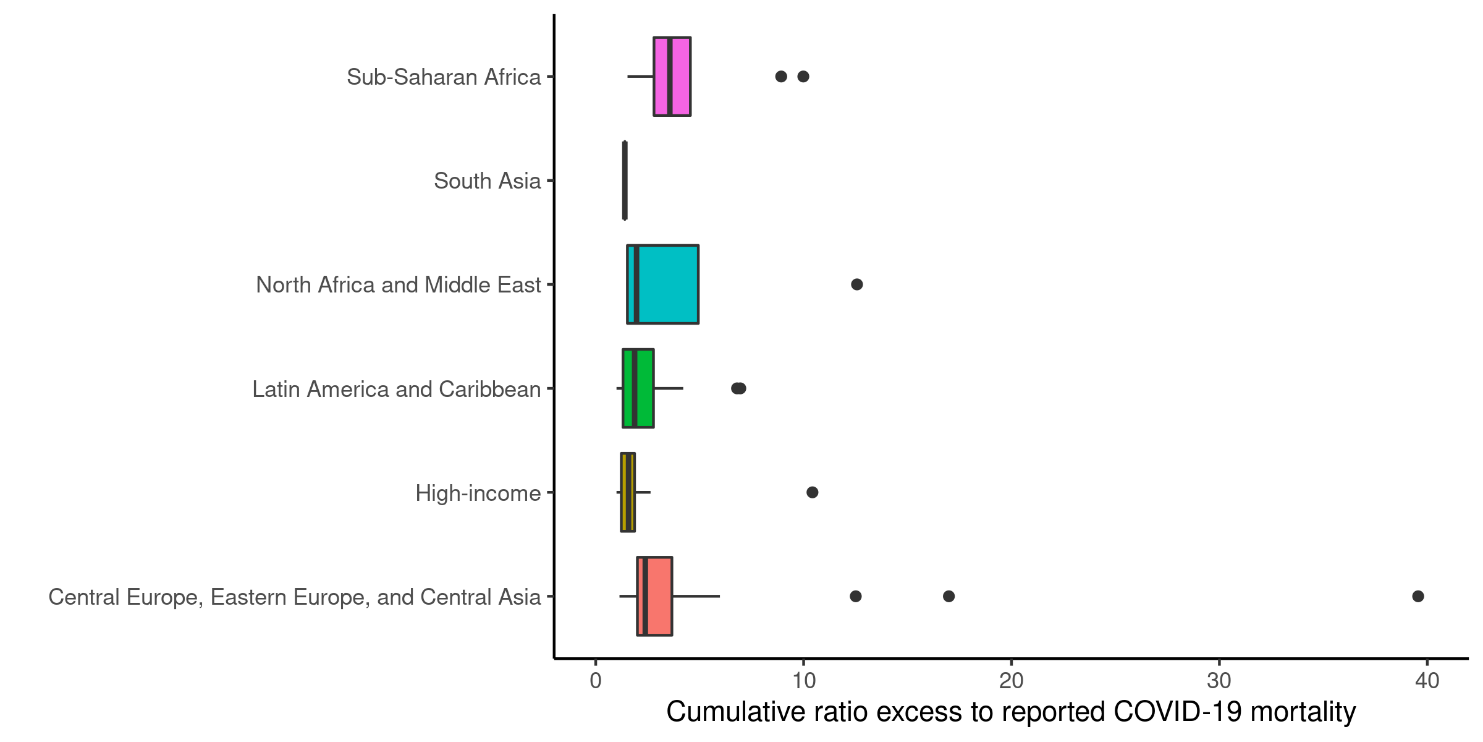
Based on our analysis, we have generated a ratio of excess mortality to reported COVID-19 mortality for each location. These analyses, based on weekly or monthly mortality data, have been supplemented with published studies for 12 national and subnational locations where the detailed data have not been made publicly available for our analysis. Figure 4 shows the distribution of these ratios in the available data.
Figure 4. Distribution of weekly/monthly ratios of excess mortality to COVID-19 mortality by Global Burden of Disease super-region
After extensive testing of potential covariates and model specifications, we developed models that predict the ratio of total COVID-19 mortality to reported COVID-19 mortality as a function of the infection-detection rate and location-specific fixed effects. We use a Bayesian cascade model to allow the relationships between the covariates and the predicted ratio to vary by region and country. More specifically, we use the bounded logit of the ratio as the dependent variable and infection-weighted average of infection-detection rate (IDR) as the covariate. First, a global spline on IDR (lagged by 19 days) is estimated. Then, the residual is fit with location-specific intercepts at four levels: subnational, national, GBD region, GBD super-region, and global.
4. Generating predictions of total COVID-19 mortality for all locations
Using the same model described in the previous section that relates the ratio of excess mortality to reported COVID-19 mortality as a function of the IDR and location-specific intercept, we predict the ratio of total COVID-19 mortality to reported COVID-19 mortality for all locations between March 2020 and April 2021. These predictions are a function of the cumulative IDR and location fixed effects and capture, through the Bayesian cascade, location-specific variation in the ratios.
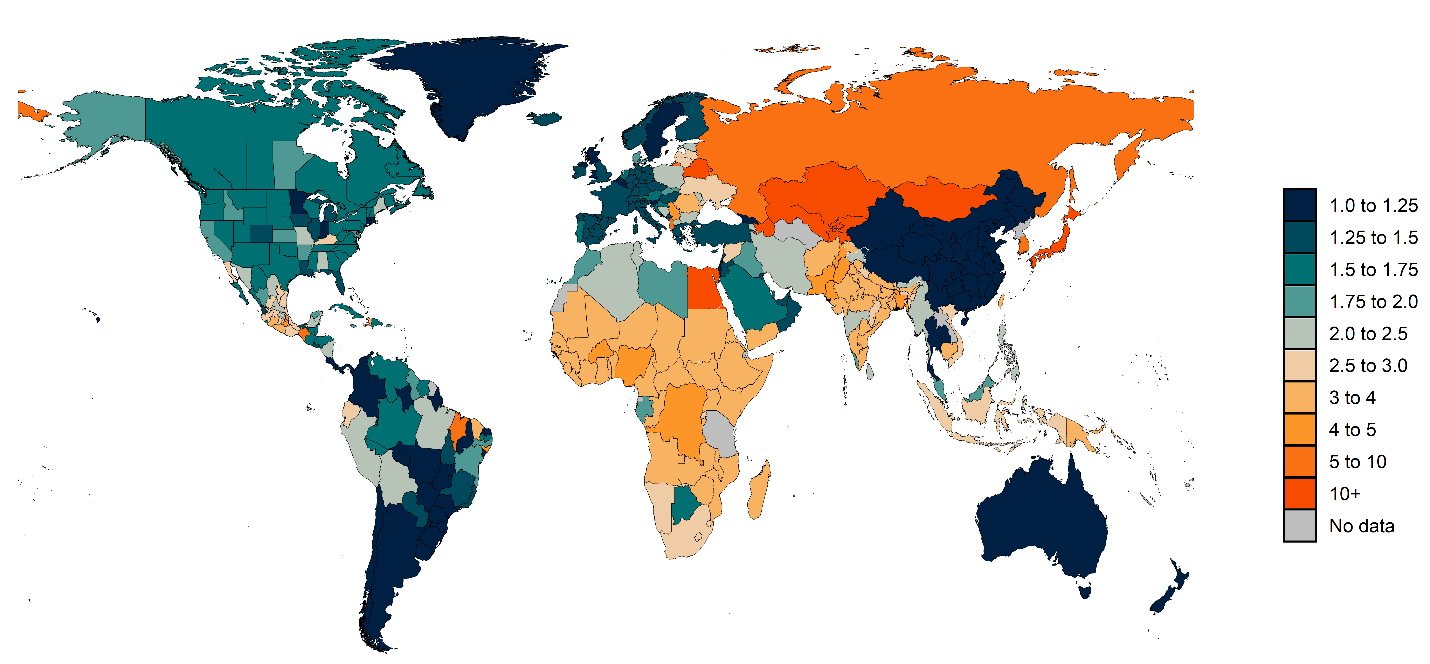
Figure 5 shows a map of the predicted ratio of total COVID-19 deaths to reported COVID-19 deaths for March 2020 to April 2021. Ratios range from very high levels in many Eastern European and Central Asian countries to ratios that are much closer to 1 in several high-income countries. Notably, for most countries in sub-Saharan Africa, which have to date reported relatively low numbers of COVID-19 deaths, we are estimating that the ratios range from about 1.6 to 4.1, suggesting that the total number of COVID-19 deaths in the region is several times higher than previously thought. Similarly, India, the country with the most recent severe wave of cases and deaths, is estimated to have an overall ratio of 2.96, which implies that the total COVID-19 death toll to date is much higher than what has been reported.
Figure 5. Predicted ratios of total COVID-19 deaths to reported COVID-19 deaths
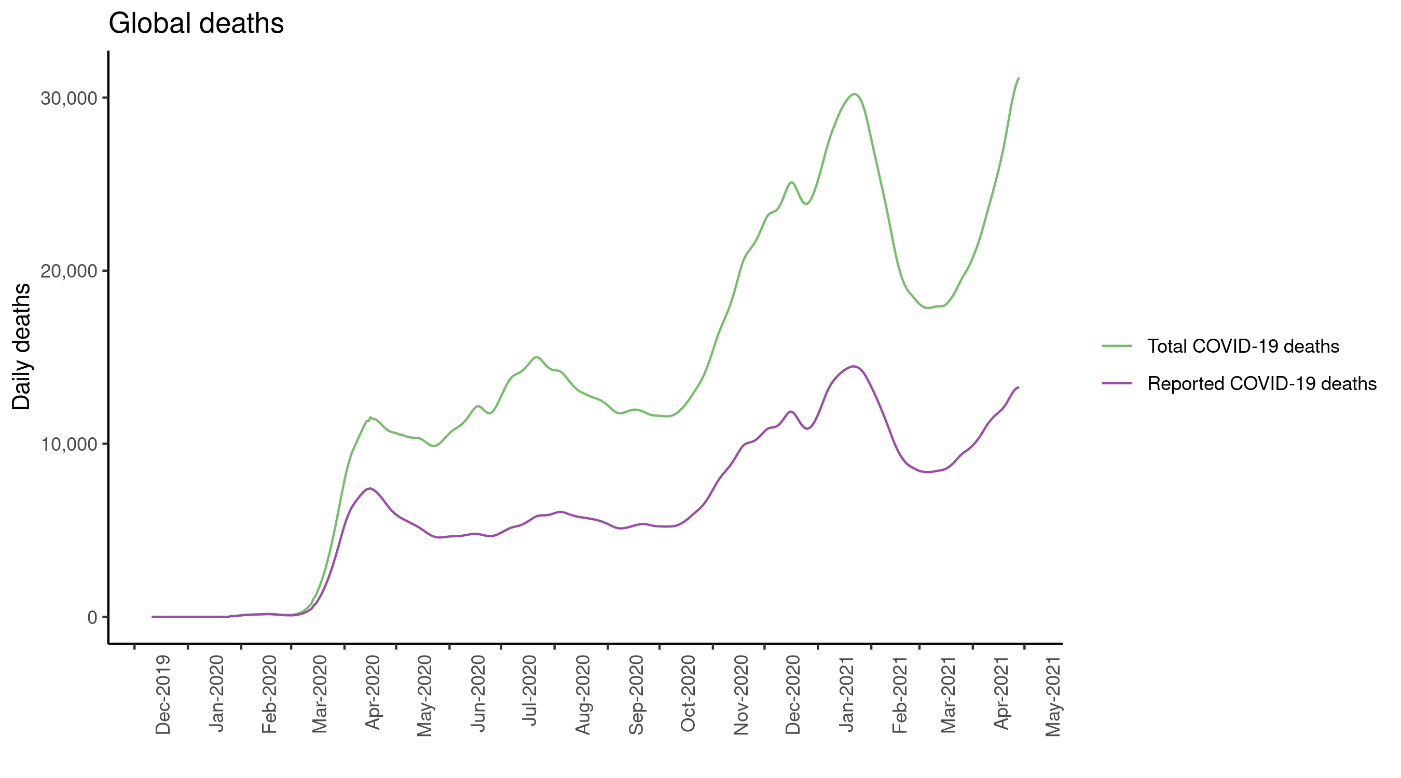
Figure 6 shows the adjusted daily deaths for the world once reported deaths are multiplied by these estimated ratios for each location and week. Our analysis estimates that by May 3, 2021, the total number of COVID-19 deaths was 6.93 million, a figure that is more than two times higher than the reported number of deaths of 3.24 million.
Figure 6. Global reported and total COVID-19 deaths, 2020–2021
Table 1 below shows the 20 countries with the highest number of total COVID-19 deaths by May 3, 2021.
Table 1. The 20 countries with the highest numbers of total COVID-19 deaths, March 2020 to May 2021
Country
Total COVID-19 deaths
Reported COVID-19 deaths
United States of America
905,289
574,043
India
654,395
221,181
Mexico
617,127
217,694
Brazil
595,903
408,680
Russian Federation
593,610
109,334
United Kingdom
209,661
150,519
Italy
175,832
121,257
Iran
174,177
72,906
Egypt
170,041
13,529
South Africa
160,452
54,390
Poland
149,855
68,237
Peru
147,765
62,739
Ukraine
138,507
46,737
France
132,680
105,506
Spain
123,786
85,365
Germany
120,729
83,256
Indonesia
115,743
45,938
Japan
108,320
10,390
Romania
87,649
28,382
Kazakhstan
81,696
5,620
Table 2. The 20 countries with the highest death rates due to COVID-19 (deaths per 100,000), March 2020 to May 2021
Country
Total COVID-19 death rate
Reported COVID-19 death rate
Azerbaijan
648.8
44.6
Bosnia and Herzegovina
587.2
262.1
Bulgaria
544.5
238.7
Albania
525.7
88.0
Mexico
493.9
174.2
North Macedonia
467.9
230.0
Belarus
459.6
27.1
Romania
455.6
147.5
Kazakhstan
444.2
30.6
Peru
434.7
184.6
Slovakia
427.6
216.6
Russian Federation
404.6
74.5
Lithuania
395.1
141.7
Poland
389.9
177.5
Czechia
386.8
276.0
Hungary
386.7
288.2
Republic of Moldova
377.6
158.4
Montenegro
338.1
242.0
Ukraine
314.5
106.1
Latvia
312.6
111.9
Globally, we observe a high level of heterogeneity in terms of cumulative total COVID-19 death rates among countries and even subnational units within a country. Figure 7 below shows the cumulative COVID-19 death rate up to May 3, 2021. While at the global level, the cumulative total COVID-19 death rate is 89.5 per 100,000, Vietnam has the lowest total COVID-19 death rate at 0.1 per 100,000. Twelve countries, on the other hand, have total COVID-19 death rates higher than 400 per 100,000, as shown in Table 2 above.


0 comments:
Post a Comment