

Why isn't tech higher? They are hiring more people. JL
Craft reports in Price Economics:
Rank the companies by Revenue Per Employee (RPE) to explore how efficiently the companies utilize human capital. Energy and Healthcare companies remained high on the list, while Industrials and Consumer Discretionaries continue to perform the worst. Tech companies are becoming increasingly more productive by growing their RPE.
The Standard & Poor's 500 Index, “S&P 500” includes the 500 largest American companies listed on the NYSE or NASDAQ. In 2017, the S&P 500 index increased by 22% from 2016-2017. S&P 500 companies generated $11 trillion in combined revenue and employed more than 25 million people worldwide.
In this report, we rank the companies by Revenue Per Employee (RPE) to explore how efficiently the companies utilize human capital. We will examine how the ranking of these companies changed from last year (S&P - Revenue Per Employee Perspective 2016). Energy and Healthcare companies remained high on the list, while Industrials and Consumer Discretionaries continue to perform the worst.
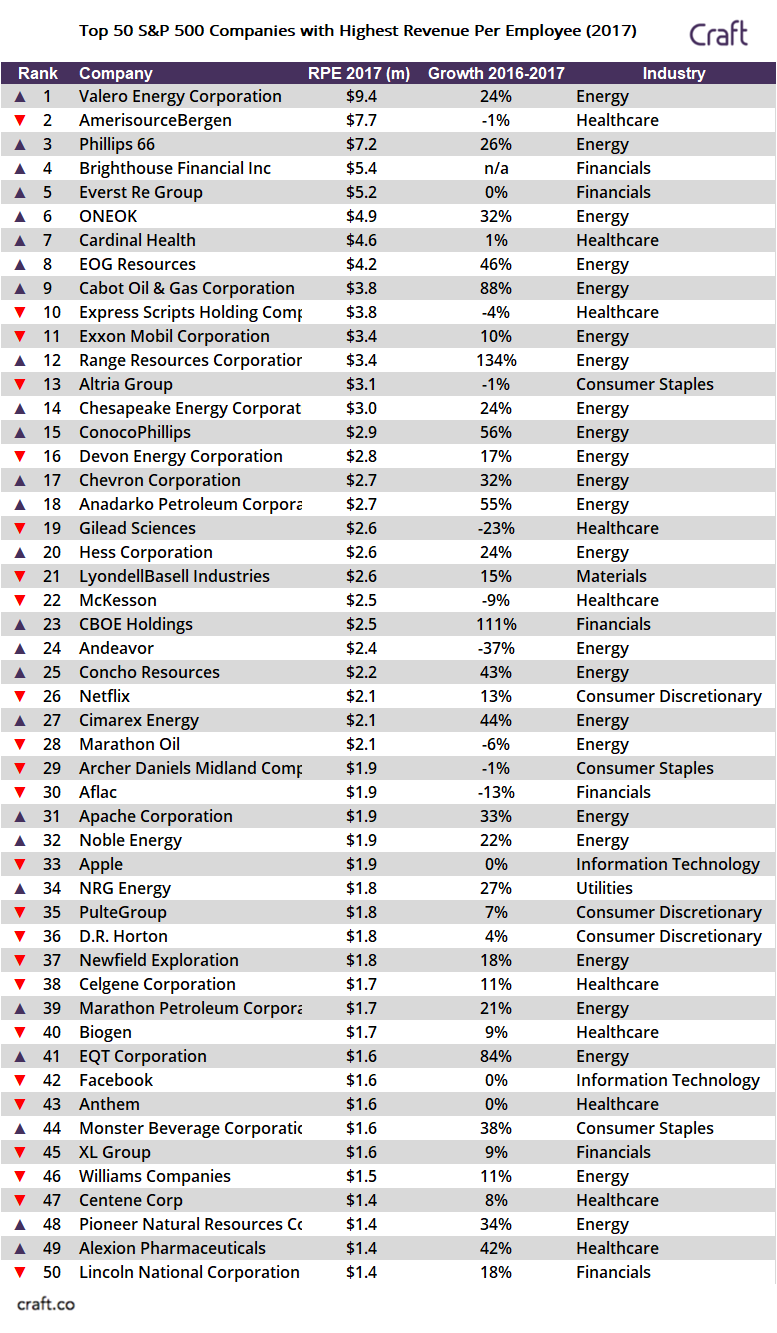
The table below shows the top 50 companies by Revenue Per Employee in 2017 in S&P 500, along with how they have moved in the rankings relative to last year’s analysis.
Data source: CraftTwenty-four Energy companies and ten Healthcare companies made the list. Energy company Valero Energy Corporation passed AmerisourceBergen and topped the list. Newcomers to the S&P 500 (compared to 2016), Everst Re Group, and Andeavor made the made the list, replacing Murphy Oil Corporation, whose RPE fell by 15% in 2017 and has been removed from the S&P 500.
We specifically omitted the Real Estate sector, particularly real estate investment trusts (REIT). REIT make revenue from pooling investor money to purchase, rent, or sell real estate. At least 90% of taxable income must be distributed to shareholders. The comanies that we excluded from the list include Host Hotels & Resorts, which owns and operates mainly luxury hotels, and Welltower and HCP, which invest primarily in real estate serving the healthcare industry, including senior housing, assisted living, and medical office.
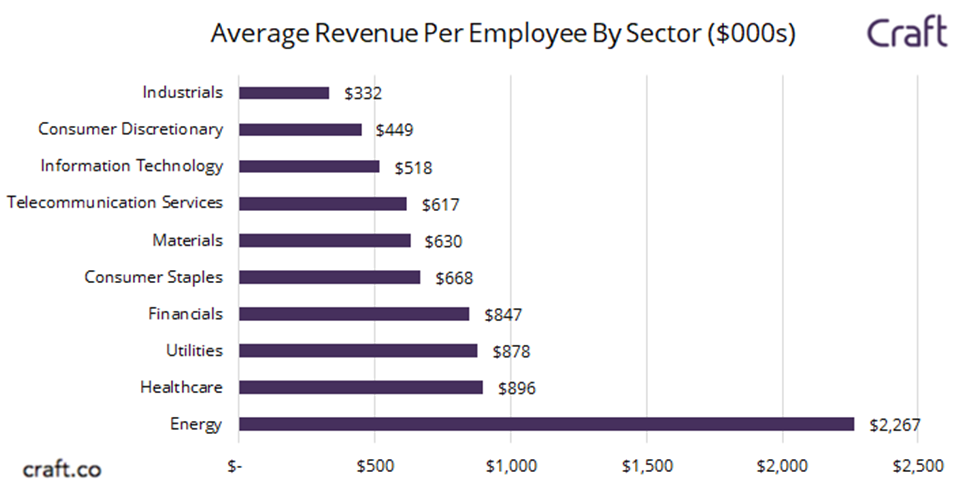
By grouping the companies into different sectors, we computed the average RPE for each sector to examine the relative labor-intensity of different industries.
Data source: CraftFor Energy companies, the business is dependent more on natural resource and physical capital rather than human capital. As a result, they are able to generate revenue with less reliance on employees than other more labor-intensive sectors.
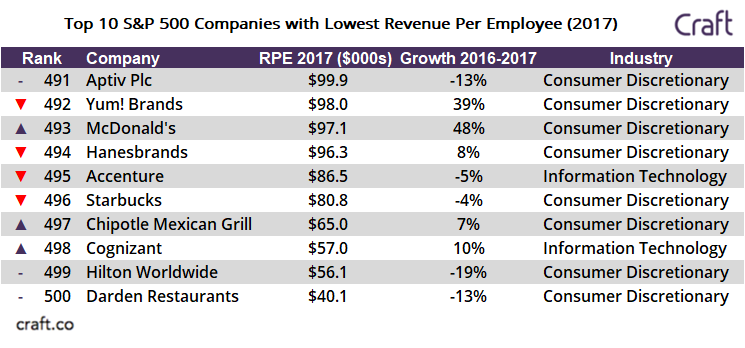
The table below shows the lowest 10 companies in the index ranked by PRE:
Data source: CraftHanesbrands, Accenture, Starbucks, Chipotle, Cognizant, and Darden Restaurants remained on the list of 10 lowest companies by RPE from last year.
We took a deeper look at why consulting companies such as Cognizant and Accenture have among the lowest revenue per employee. Accenture and Cognizant are IT consulting with 425,000 employees and 260,000 employees respectively. As both companies are IT providers and provide consulting services, they depend on large teams to deliver services. The two firms performance are strongly linked to how many consultants they have and how many engagements they book. At Accenture, the employee headcount grew by 12% from 2014-2017, while revenue increased 5%. A larger increase in hiring than revenue led to a decrease in RPE.
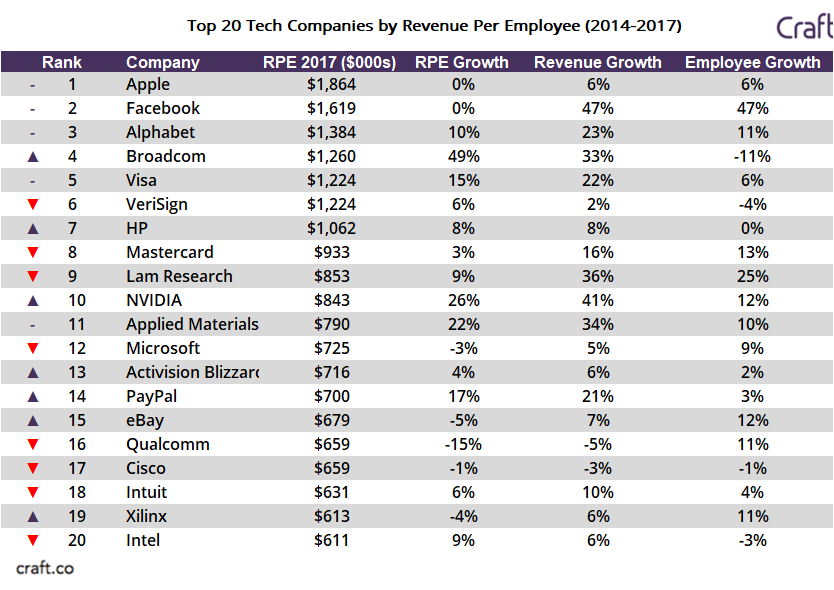
For Tech companies’, we looked at RPE and Compound Annual Growth Rate of Revenue and Employees between 2014-2017:
Data source: CraftThere is generally a growth in Revenue per Employee for Tech companies. Most companies on this list grew their revenue faster than employee headcount.
Key takeaways:
- The Energy sector continues to be the highest performer on RPE, representing almost 50% of the Top 50 list. Since 2016, the average RPE in the Energy sector has increased from $1.79M to $2.27M.
- The Industrials sector remains the lowest performer on RPE, even with an increase from $321,000 in average RPE to $332,000 in average RPE from 2016-2017.
- Tech companies are becoming increasingly more productive by growing their RPE.


0 comments:
Post a Comment