Why Bot-Designed Maps Are Growing As Disinformation Vectors
People expect maps to be accurate, authoritative and trustworthy. Which is exactly why they being targeted by those intent on spreading misinformation. JL
Katharine Schwab reports in Fast Company:
Maps are a particularly ripe format for spreading misinformation on the internet because we’re so used to trusting them as fact. “It’s cool that anybody can make a map now. (But) when people see a map–even when it’s shared on a social media platform - they may not understand it’s being
amplified in a certain direction to influence them. They can take election data
and do something creative with it, and it can be very helpful. But it’s also easy to make something that looks authoritative and use it as a weapon.”
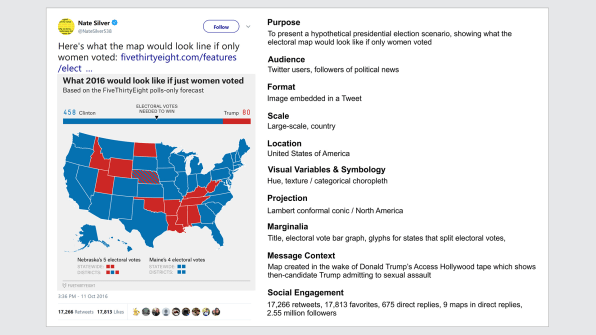
About a month before the 2016 election, statistics guru Nate Silver posted a set of maps on Twitter using a set of poll data from his website Five Thirty Eight. One was titled, “What 2016 would look like if just women voted,” and showed a mostly blue electoral map, and the other was titled, “What 2016 would look like if just men voted,” which depicted a mostly red United States with a few blue outliers.
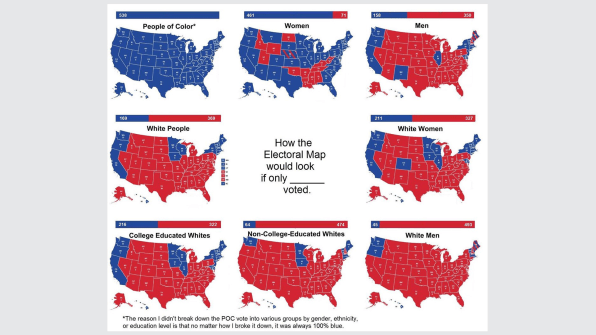
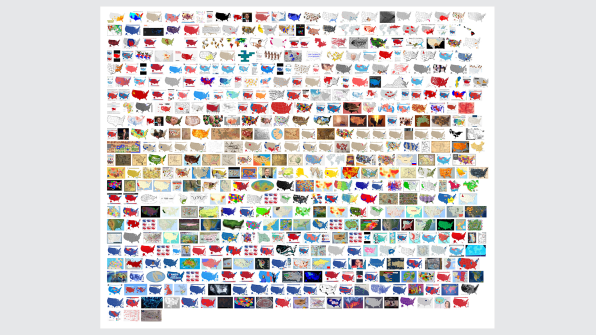
The maps went viral, with a total of 17,000 retweets between the two tweets, and spawned hundreds of copies, some serious, some not. There are maps examining what the election might look like if only people of color voted, or just white women, or just college-educated folks. There are meme maps that show what the map looks like if only mice voted, or if only states that form a smiley face voted. A parody of Silver’s original men’s voting map shows a toss-up between Hulk Hogan, Trump, and literal fire. Part of the country is a nuclear wasteland and part has been taken over by intelligent apes. [Image: Anthony Robinson/Penn State University]A new analysis of “viral maps” published in Cartography and Geographic Information Science examines the more than 500 maps that sprang from Silver’s original one, using Google’s Cloud Vision image analysis platform. The study also points out maps that were created with the pure purpose of misinforming. One egregious example, which claimed to represent an electoral map if only taxpayers voted, was simply a retitled map of something else entirely.According to Anthony Robinson, an assistant professor of geography at Penn State University who conducted the study, maps are a particularly ripe format for spreading misinformation on the internet because we’re so used to trusting them as fact. [Image: Anthony Robinson/Penn State University]“Maps are graphics we trust all the time,” he says. “We use them constantly to move around the city and make decisions about where we’re going to live and find a place to eat. And we get angry when the map isn’t right. Like, ugh, this Thai place is supposed to be right here, what’s going on?”That puts maps–particularly viral maps–on the front lines of the war on fake news. “The attributes of a map that can convince somebody that something’s real haven’t really changed, and that’s part of the problem,” he says. “My hypothesis is that when people see a map–even when it’s shared on a social media platform, and maybe they should be skeptical–they may not understand it’s being amplified in a certain direction to influence them.”
Where there’s misinformation, there’s usually bots involved. Robinson thinks that right now, maps like the one claiming to show what it might look like if only taxpayers voted are likely being disseminated and amplified using bots.
But it may be only a matter of time before bots begin to generate maps automatically. The technology exists: Robinson points to the increasing prevalence of auto-generated video called deepfakes, which are a far more complicated type of algorithm than one that could create a misleading map from scratch. “At the moment, I don’t have conclusive proof that there are bots making maps,” he says. “But I am almost certain that it’s happening . . . my theory is that it’s quite possible to automatically generate such things, and we don’t know yet how to detect them.”
[Image: Anthony Robinson/Penn State University]More research needs to be done to verify his hypothesis. But the bigger problem lies in educating people so that their first instinct is to be skeptical when they see a map on social media. While Robinson thinks media literacy is a laudable goal, he doesn’t believe it’s practical. Instead, he’s hoping to use machine learning image detection algorithms like those from Google Cloud Vision to trace the provenance of maps and how they spread online. Because algorithms have the capability to find both exact and partial images matches, they could potentially show users the lineage of a map’s journey through cyberspace.He envisions a scenario in which someone is scrolling through Twitter, sees a map, and can mouse over it to see when it was first posted, and how many remixed versions there are–giving online maps metadata that follow them around the web to give users more information about their origins. Further analysis of which maps go viral and which don’t could also point to what design elements make maps more likely to be shared.
For Robinson, the proliferation of maps that came out of Nate Silver’s original one in 2016 is also exciting because it shows just how accessible map making has become–but it remains a double-edged sword.
“It’s cool that anybody can make a map now. They can take election data and do something creative with it, and it can be very helpful,” Robinson says. “But it’s also easy to make something that looks like it’s authoritative and use it as a weapon.”
As a Partner and Co-Founder of Predictiv and PredictivAsia, Jon specializes in management performance and organizational effectiveness for both domestic and international clients. He is an editor and author whose works include Invisible Advantage: How Intangilbles are Driving Business Performance. Learn more...


0 comments:
Post a Comment