

Lisa Lacy reports in Ad Week:
The average daily time consumers spend on mobile in minutes surpassed TV in 2019. Ad spend in desktop and mobile drew even with the percentage of time consumers spent in those channels—18% for desktop and 33% for mobile. ( programmatic buying was 62% of ad spend.) Visual ramped from editing and sharing to data-driven discovery to commerce. 91% (of users) prefer personalized offers; 83% are willing to share data for personalization. Consumers around the world are less concerned about internet privacy than they were four years ago.
Venture capitalist Mary Meeker is back with her annual Internet Trends report, with another look at where we collectively stand in technology, advertising, consumer behavior and society.
There are some recurring themes, like privacy, offensive content, the gig economy and China’s leadership in digital video and retail.
Surprisingly, there was little mention of Amazon or Alibaba in the latest report. Instead, new topics like Fortnite, freemium business models and screen time found their way into Meeker’s 333 slides.
From her report, we culled 10 topics and highlights. Consider it Mary Meeker, Abridged:
1. Online Advertising
In 2018, the percentage of advertising spend in desktop and mobile channels drew even with the percentage of time consumers spent in those channels—18% for desktop and 33% for mobile. (And programmatic buying was up to 62% of display ad spend globally.)
In 2010, on the other hand, consumers spent 25% of their time on desktops and advertisers spent 19% of their budgets there, versus 0.5% spend on mobile with consumers spending 8% of their time there.
Internet ad spend was up 22% overall in the last year, which is slightly higher than the 21% growth in 2017. Meeker said platforms that gain ad share are doing so with better targeting, new creative, commerce and high relevance.
2. Second Screens
The average daily time consumers spend on mobile in minutes surpassed TV in 2019: 226 minutes for mobile versus 216 minutes for TV. However, the impact of digital TV-based ads aided by in-hand mobile devices remains to be seen.
YouTube and Instagram are gaining the most online platform time (up 27% and 19% respectively in Q4 2018) and digital video is now up to 28% of average daily watching time.
The report also noted daily hours spent with digital media per adult user in the U.S. increased to more than six hours in 2018, from just under six hours in 2017.
3. On-Demand
Get-it-when-you-want-it products and services increased from about 40 million in 2017 to 56 million in 2018. Online marketplaces are the most popular, followed by transportation, housing, food delivery and health/beauty.
Similarly, on-demand platform workers numbered 6.6 million in 2018, up from 5.4 million in 2017, Meeker added.
4. Visual Communication
Instagram is up to 1 billion monthly active users, and more than 50% of tweet impressions include images, videos or other media.
Meanwhile, we’re seeing visual platform functionality ramp from editing and sharing to data-driven discovery to stories and commerce on platforms like Instagram and Pinterest.
The number of edited images overall is also growing rapidly. For example, views of user-generated Snap lenses totaled more than 35 billion as of March 2019.
5. Interactive Gaming
There were 2.4 billion interactive game players globally in 2018, which is growth of 6%, versus 5% the year prior. Online game Fortnite had 250 million users as of April 2019—and nearly one major update per week by May 2019, which Meeker said demonstrates innovation is rising across these platforms.
And thanks to multiplayer cross-platform games, along with in-game events and experiences and collaboration with squadmates, Meeker asked if interactive games are the new social networks.
6. Freemium Business Models
Free trials and tiers, like online streaming services, enable more usage, engagement, social sharing and network effects while premium models drive monetization and product innovation, Meeker said.
Pure-play freemium businesses with more than 10 million paid subscribers as of March 2019 include Epic Games, Dropbox and Spotify. In fact, Spotify’s freemium model accounts for 60% of its gross added premium subscribers. These businesses also had more than $1 billion in revenue last year.
6. Data and Personalization
Context-rich data yields happier customers, but Meeker said companies are “drinking from a data firehose” because of real-time customer information capture.
She said successful businesses will build and use data-plumbing tools to harness digital data and insights to improve user experience. That includes brands like Adidas, which works with Salesforce to increase customer input and improve products, and Instacart, which works with Snowflake to optimize data to improve analytics, recommendation and personalization.
And, when used properly, data and AI can improve customer satisfaction.
In a survey of retail customers, 91% said they prefer brands that provide personalized offers and recommendations; 83% said they are willing to passively share data for personalized experiences; and 74% said they are willing to actively share data for personalized experiences.
Meanwhile, in 2018, the share of total data stored by consumers was surpassed by enterprises—and the total data stored in the cloud is expected to surpass consumers in 2020 and then enterprises in 2022.
7. Consumer Concerns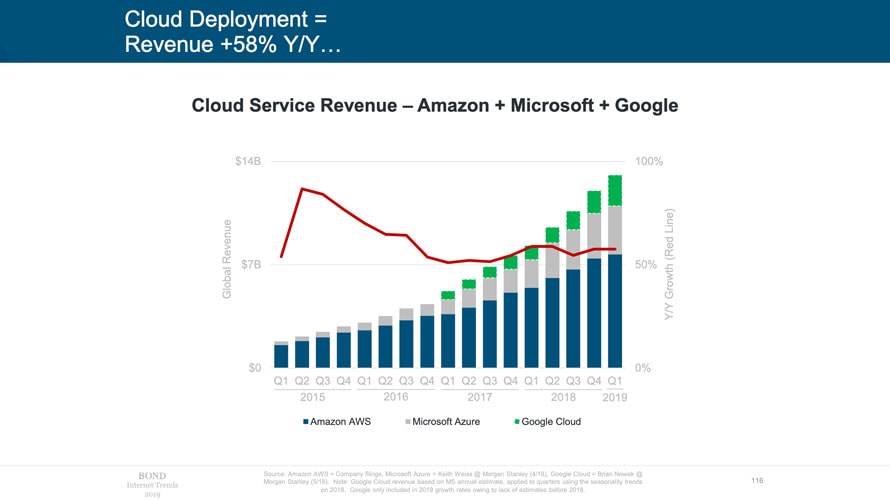
Consumers are more aware of digital overload and are taking steps to reduce screen time: 63% of U.S. adults say they are trying to limit personal smartphone usage in 2018, which is up from 47% a year prior.
And platforms have rolled out tools to help, like Apple’s Screen Time, Google’s Digital Wellbeing, Facebook’s Your Time on Facebook and YouTube’s Time Watched. As a result, social media use is decelerating—it was down to just 1% growth in January 2019 compared to 6% growth in January 2018 and 12% in January 2017.
At the same time, consumers around the world are less concerned about internet privacy than they were four years ago. That’s perhaps in part because regulators and platforms alike are working to improve consumer privacy control. The impact of privacy changes on ad targeting, however, remains to be seen. Facebook, for example, has said it will roll out GDPR-type controls globally and a Clear History feature later this year, which will affect its ability to do third-party targeting.
8. Offensive Content
Problematic content is also top of mind for consumers, and an age-old challenge for regulators has resurfaced, which is this: How do you amplify the good and minimize the bad? This, in itself, results in different interpretations and strategies, Meeker said.
That being said, consumers generally prefer negative news—and content on the internet can be less filtered. Plus, social media can amplify trending topics. And, in 2018, 43% of respondents to a Pew survey said they got their news headlines from Facebook, 21% from YouTube and 12% from Twitter.
Algorithms can amplify users’ own patterns as newsfeeds are curated using search history (Google), reading history (Apple), followed accounts (Twitter) and followed interests (Reddit).
What’s more, bad actors can amplify ideologies and misinformation, leading to more polarization as social media and the proliferation of media channels via the internet and TV allows people to communicate exclusively with people like themselves.
Internet platforms, however, are driving efforts to reduce problematic content, Meeker noted.
9. Open Internet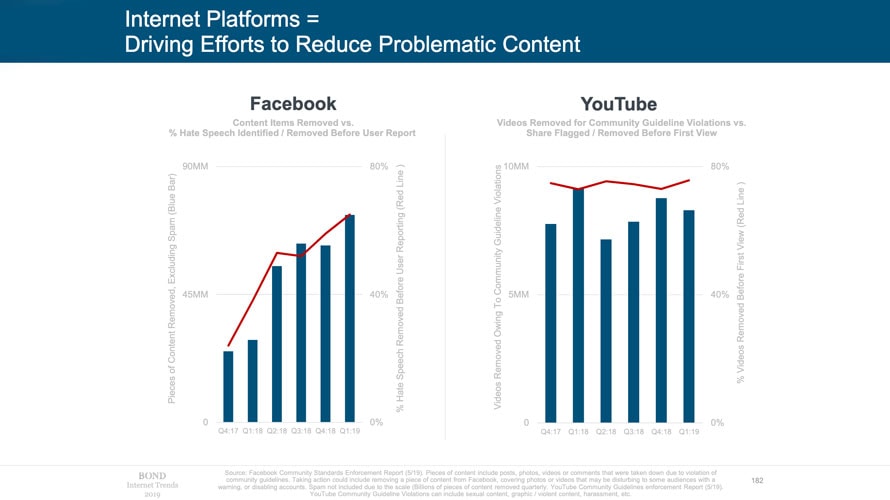
Meeker said an open internet can benefit everyone as consumers get what they want efficiently and inexpensively, businesses sell products and services profitably and regulators protect consumers, businesses and social institutions.
So we may need something like an Algorithmic Bill of Rights. At the same time, Meeker pointed out a highly regulated internet can favor state control.
10. Digital Healthcare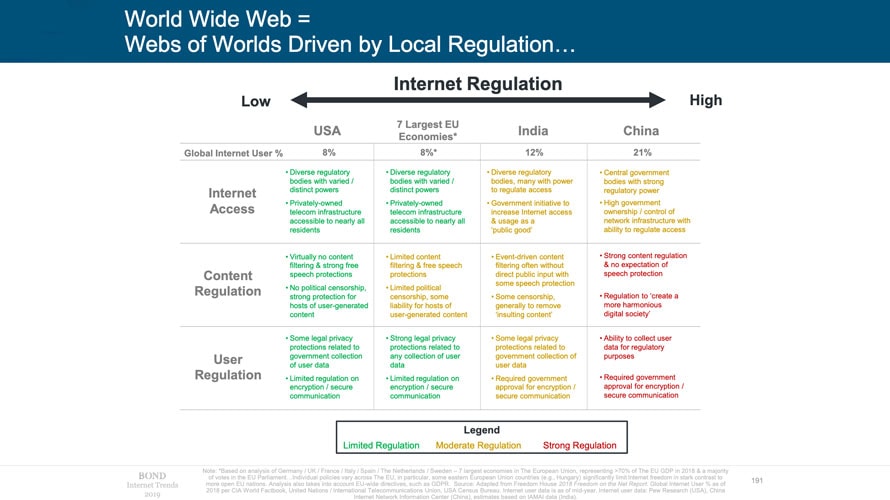
Costs are high and rising for both the government and consumers.
Insurance is increasingly from the government instead of employers: Employer coverage was 54% in 2017 versus 63% in 2008, while government coverage was up to 39% in 2017 from 30% in 2008.
Consumers are also driving a steady digitization of healthcare, Meeker said.
Internet research increases access to data and decision-making tools, while genomic testing yields a growing base of personal genetic data and on-demand urgent care reduces time to receive treatment. Telehealth and telemedicine are improving patient-practitioner relationships, prescription delivery is increasing convenience and affordability and health-incentive tools are driving positive changes via savings and personalized rewards.
Electronic health-record adoption is nearing 100% for hospitals and doctor’s offices, but they say they still need interoperability and predictive analytics. And healthcare providers can use a service like Zocdoc to fill the 20-30% of their unused appointments.


0 comments:
Post a Comment