Yes. The official unemployment rate does not necessarily count furloughed workers, nor does it count people working reduced hours for less income. And the nature of Covid-19 has made it difficult for people to look for work, which may also disqualify them for inclusion in the unemployment figures.
The implication is that the economic impact of the pandemic may be much greater than the official numbers suggest. JL
The unemployment rate only captures a fraction of losses because the Covid-19 crisis has led
to the furlough of many workers and made it difficult for
people to look for new work. To count as unemployed, one must be out
of work, on temporary layoff or looking
for new work. This leaves out people employed at reduced hours. Due to stay-at-home orders many find it hard to look for work and be classified as unemployed. Underutilization is tailored to the Covid-19 crisis. Between February and March, the unemployment rate rose from 3.8% to
4.5%, an increase of 1.2 million workers.1 But underutilization rose from 10.4% to 12.9%, an increase of 4.1 million workers.
Summary
We know that tens of millions of people are currently out of work in the United States. More than 26 million workers filed for unemployment benefits between mid-March and mid-April alone. The most popular measure of the strength of the labor market is the unemployment rate. Forecasts for how much it will rise in the coming months vary widely, but many economists now expect an increase to at least 15%, and perhaps much more.
Despite its popularity, the official unemployment rate does not capture all workers facing adverse employment conditions. To count as unemployed, one must be out of work and either on temporary layoff or actively looking and available for new work. This leaves out many people who want to work but did not look for work in the period covered by the data, as well as people who may remain employed but at substantially reduced hours.
The Labor Department has alternative, broader measures of labor market underutilization that track these individuals, too, but the unique nature of the downturn caused by the Covid-19 crisis and the subsequent stay-at-home directives has put people out of work in ways that even these alternative measures may miss. For example, the evidence suggests that employment losses are likely in the tens of millions, but many individuals are finding it hard to actively look or be available for work and therefore be classified as unemployed.
We have developed a new measure of labor market
underutilization that is tailored to the Covid-19 crisis. Between February and March, the official unemployment rate rose by 0.8 percentage points, from 3.8% to 4.5%, representing an increase of 1.2 million workers.
1 But our measure rose by 2.5 percentage points, from 10.4% to 12.9%, representing an increase of about 4.1 million workers. If we project these changes under different scenarios to get an idea of what we might expect for the April employment report, we get unemployment rates ranging from 8.2% to 16.0%, marking an additional rise ranging from 3.7 to 11.5 percentage points in the official unemployment rate. These are staggeringly large increases, but they pale in comparison to the projected increases in our new measure of between 12.2 and 21.7 percentage points. We project our new measure will rise to between 25.1% and 34.6%.
Labor Market Changes through March
We start with a deeper examination of the latest estimates from the Labor Department’s household survey, known as the
Current Population Survey. We tabulate the most recent two months of data by more detailed labor force categories than what the Labor Department reports in its monthly Employment Situation report. Specifically, we separate the employed by whether they were at work in the prior week or on leave, and if on leave, whether the leave was paid or unpaid. We also separate those out of the labor force based on whether they reported wanting work (despite not searching or reporting themselves available for work). We also tabulate other detailed categories that appear in the Employment Situation report, such as those who are working part time for economic reasons, those who are on temporary layoff, and those who are “marginally attached” to the labor force.
2
Table 1 reports the over-the-month changes in these categories on a seasonally unadjusted basis. Between February and March, the labor force shrank by 1.7 million and employment fell by almost 2.9 million. Unemployment rose by nearly 1.2 million. Table 2 shows that these changes caused the labor force participation rate to fall by 0.7 percentage points, the employment-to-population rate to fall by 1.1 percentage points, and the official unemployment rate—technically referred to as the “U3” unemployment rate—to rise by 0.8 percentage points.
Table 1 also shows that the changes in these headline numbers mask important underlying changes. Total employment fell by 2.9 million, but the number of people actually paid and at work fell by 5.1 million. The difference is due to a rise in those on paid leave by over 900,000 and a rise in those on unpaid leave by nearly 1.4 million. Furthermore, an increase in those on temporary layoff, which more than doubled over the month, accounts for nearly all of the rise in unemployment. Finally, the number of people out of the labor force rose by more than the number of unemployed, increasing by over 1.8 million, with over 300,000 of the rise accounted for by those who wanted work but did not actively search for it.
These figures represent labor market changes through mid-March. Thus, they occurred before many of the stay-at-home directives were put in place. We expect much larger changes between March and April.
Table 1. Detailed labor force changes, in thousands, February–March 2020
| Category | Feb 2020 | March 2020 | Net Change |
|---|
| Total Population | 259,628 | 259,758 | 130 |
|---|
| Total Labor Force | 164,235 | 162,537 | –1,698 |
|---|
| Total Employed | 158,017 | 155,167 | –2,850 |
|---|
| Paid, at work | 153,868 | 148,727 | –5,141 |
|---|
| Full-time employed | 118,052 | 113,895 | –4,156 |
|---|
| Part-time for economic reasons | 4,609 | 5,877 | 1,268 |
|---|
| Part-time for noneconomic reasons | 31,207 | 28,954 | –2,253 |
|---|
| On paid leave | 1,932 | 2,870 | 938 |
|---|
| On unpaid leave | 2,218 | 3,571 | 1,353 |
|---|
| Total Unemployed | 6,218 | 7,370 | 1,152 |
|---|
| Actively looking for work | 5,147 | 5,149 | 3 |
|---|
| On temporary layoff | 1,071 | 2,221 | 1,149 |
|---|
| Total Not in Labor Force | 95,393 | 97,221 | 1,828 |
|---|
| Want work but did not look for work | 4,472 | 4,797 | 325 |
|---|
| Marginally attached | 1,071 | 865 | –207 |
|---|
| All others out of the labor force | 90,921 | 92,424 | 1,503 |
|---|
Table 2. Changes in selected labor force measures, February–March 2020
| Category | Feb 2020 | March 2020 | Net Change |
|---|
| Labor force participation rate | 63.3 | 62.6 | –0.7 |
|---|
| Employment-to-population ratio | 60.9 | 59.7 | –1.1 |
|---|
|
|
|
|
| U3 official unemployment rate | 3.8 | 4.5 | 0.8 |
|---|
| U6 alternate underutilization rate1 | 7.2 | 8.6 | 1.4 |
|---|
| U-Cov underutilization rate2 | 10.4 | 12.9 | 2.5 |
|---|
A Broader Measure of Labor Market Underutilization
Tables 1 and 2 show that the official U3 unemployment rate did not capture millions of individuals who were not at work. It also did not capture people working part-time for economic reasons, a number that rose by nearly 1.3 million between February and March. These are individuals who report that they would rather work full-time if such work were available to them.
To deal with these issues, the Labor Department reports several other measures of labor market underutilization. One such measure is the “U6” underutilization rate, which counts all unemployed, plus those who are part-time for economic reasons and those who are marginally attached to the labor force (as a percentage of labor force plus the marginally attached). However, even the U6 measure fails to capture some of the largest changes reported in table 1. For example, it does not capture the large rise in people on unpaid leave and only captures the decline in those marginally attached to the labor force between February and March, missing the overall increase in those who wanted work but did not actively search, as well as those who left the labor force in other ways.
As an alternative, we introduce the “U-Cov” measure of unemployment. Our measure builds on the U6 measure of underutilization. It adds to it the total number of individuals still employed but on unpaid leave. It also adds individuals who are out of the labor force and want work but do not meet the criteria to classify as marginally attached. We express our U-Cov underutilization rate as a percentage of the labor force plus those out of the labor force that want work.
There are several reasons we think this broader measure is a more relevant measure of labor market underutilization during the current crisis. First, unpaid leave normally has little to do with the business cycle, but figure 1 shows that the share of the employed on unpaid leave spiked in March, and we believe this spike is related to the Covid-19 crisis.
3 There was a similar spike in the share of the labor force on temporary layoff. These spikes likely represent the wave of individuals placed on furlough or other types of temporary leave due to the stay-at-home directives. Second, there is a high chance that many workers may be
misclassified in the official statistics. For example, according to the Labor Department, those on furlough should count as temporarily laid off, but the spike in unpaid leave suggests that not all of them are counted that way. Third, some of those who have lost their jobs due to the crisis may not meet the criteria for counting as unemployed because they did not search for new work, either because they believed the stay-at-home directives have halted hiring or because they believed the directives made them unavailable to start a new job (being available to start work is an additional criterion one must meet to officially count as unemployed). These individuals would be counted as out of the labor force. Figure 1 shows a spike in the fraction of employment that exited the labor force in March, suggesting that the crisis led more individuals to exit the labor force as well.
4 Finally, figure 1 shows that the fraction of employment that is part-time for economic reasons also spiked in March. This share is historically highly cyclical, and is part of both the U6 and U-Cov measures of underutilization.
Figure 1. Selected labor force measures over time
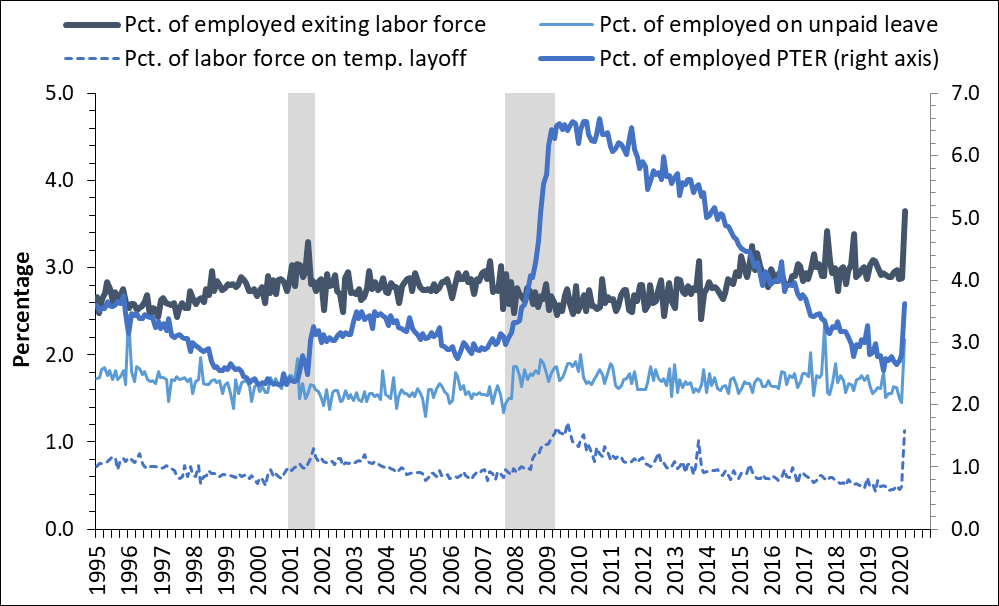
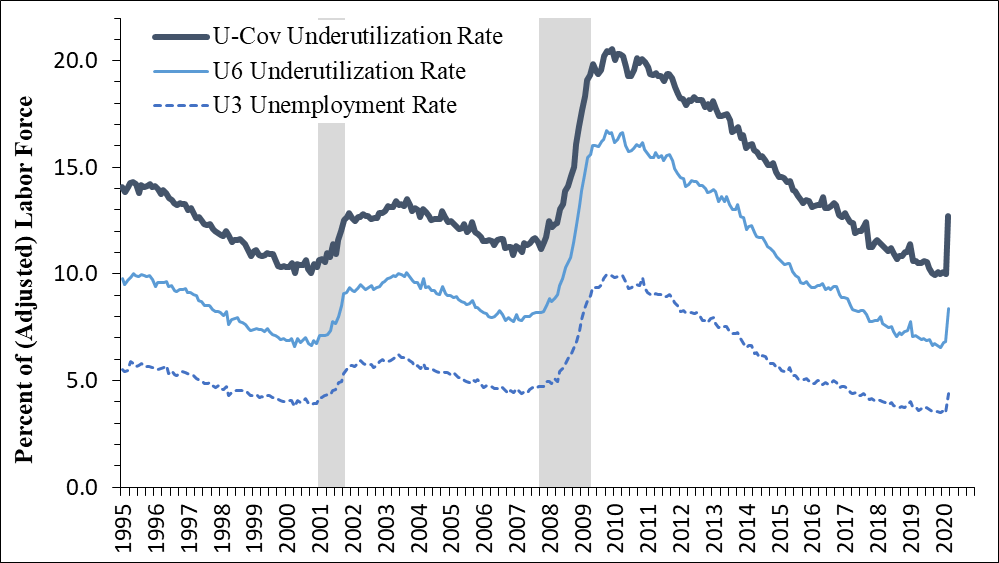
Figure 2 shows the behavior over time of the official U3 unemployment rate, the broader U6 underutilization rate, and our even broader U-Cov underutilization rate. Since 1995, all three measures have behaved similarly over time. During the Great Recession, the U6 and U-Cov measures rose relatively more than the official unemployment rate, mostly because of the historically large rise in those working part-time for economic reasons (observed in figure 1). All three measures spiked in March, but to different degrees. The official unemployment rate rose by 0.8 percentage points. The U6 measure rose even more, by 1.4 percentage points. The rise in those working part-time for economic reasons accounts for the entire difference, since the number of those marginally attached to the labor force fell somewhat in March. Our U-Cov measure, however, rose by 2.5 percentage points. The larger increase reflects the rise in the number of workers on unpaid leave and in those who are out of the labor force but want work.
Figure 2. Measure of labor market underutilization over time
Projecting Changes into the Future
A big question is what these observations on the effects of the Covid-19 crisis in March imply for what we can expect in the coming months. To answer this question, we project the distribution of labor market changes we observe in table 1 into April, assuming three different scenarios for employment losses. Our baseline scenario assumes that total employment falls by 20 million between February and April (implying a loss of 17.1 million in April in addition to the 2.9 million lost in March). We also explore a more optimistic scenario where total employment falls by 16 million and a more pessimistic scenario where total employment falls by 24 million. This range mostly captures the estimates reported in recent labor market studies that use special surveys or statistical predictions.
5 To generate projections for the remainder of the labor force categories, we scale up the changes observed in table 1 to be consistent with the assumed employment loss. We also ensure that the changes in employment, unemployment, and those out of the labor force all add up in a consistent manner.
We also evaluate two alternative assumptions for each scenario. These assumptions allow for the possibility that some of the misclassification and survey reporting issues we noted earlier may be addressed in the April survey, or that some of the employment losses that were temporary become permanent while some people who were already out of work begin to look for new work. First, we assume that 25% of the March increases in those on unpaid leave and those out of the labor force that did not report wanting work are counted as unemployed in April. And second, we assume that 50% of the March increases in these groups are counted as unemployed in April.
The results of these projections are in table 3. In our baseline scenario, the exercise predicts that the official unemployment rate would rise to 9.4%, an increase of 7 million individuals. In contrast, if one naively assumed that all 26.5 million individuals who filed a claim for unemployment benefits during the survey month were counted as unemployed, it would imply a 16 percentage point increase in the unemployment rate, to nearly 21%. Such a rise is closer to, but still considerably larger than, the 10.3 percentage point increase we predict for the U6 underutilization rate, which would rise to 18.9%. Keep in mind that the U6 rate includes both those out of work and those who are part-time for economic reasons, and therefore starts from a higher initial value. The increase is more comparable to the 17.1 percentage point increase we predict for the U-Cov rate, which would rise to 29%. Keep in mind that the U-Cov rate additionally includes those on unpaid leave and those who want work but are counted as out of the labor force, and so starts from even higher initial value. The predicted increase in the U-Cov rate represents an increase of more than 24 million individuals.
Assuming that more individuals will instead count as unemployed increases our prediction of the official unemployment rate by 2.2 or 4.4 percentage points, to 11.6% or 13.8%, depending on the assumption used. Since these assumptions reflect a reclassification of individuals mostly captured by the U-Cov measure already, our measure only rises an additional 0.7 or 1.4 percentage points, depending on the assumption used, from 29% to either 29.7% or 30.4%.
6 In our more optimistic scenario of 16 million jobs lost, the official unemployment rate rises to 8.2%, while the U-Cov rate still rises more than 12 percentage points to 25.1%. So the U3 and U-Cov rates rise to 11.5% and 26.2%, respectively, under our assumptions of a higher share of those out of work being classified as unemployed. In our more pessimistic scenario of 24 million jobs lost, the official unemployment rises to 10.6% and the U-Cov rate rises over 20 percentage points to 33%, with the U3 and U-Cov rates rising up to 16% and 34.6%, respectively, under our assumptions of a higher share of those out of work being classified as unemployed.
In summary, more than 26 million new unemployment claims are already reported between mid-March and mid-April, and job losses could exceed 20 million through April. The official unemployment rate may only capture a fraction of these losses. This is because the unique nature of the Covid-19 crisis has led to the furlough of many workers and has also made it difficult for people to look for new work, even if jobs are available. In this blog, we have proposed an alternative measure of underutilization, the U-Cov rate, which captures a broad range of workers affected by the crisis. This rate reached 12.9% in March, up 2.5 percentage points from its February level. We predict that it could reach between 25.1% and 34.6% in April, an increase of 16 to 21 percentage points, reflecting the breadth of the sharp contraction currently affecting the labor market.
Table 3. Projected estimates of underutilization
| U3 Unemployment Rate | U6 Underutilization Rate | U-Cov Underutilization Rate |
|---|
| March 2020 Estimate | 4.5 | 8.6 | 12.9 |
|---|
| April 2020 Scenarios |
| Baseline, assuming a loss of 20 million workers | 9.4 | 18.9 | 29.0 |
|---|
| Further assuming a 25% shift to unemployment | 11.6 | 20.9 | 29.7 |
|---|
| Further assuming 50% shift to unemployment | 13.8 | 23.1 | 30.4 |
|---|
|
| More optimistic, assuming a loss of 16 million workers | 8.2 | 16.4 | 25.1 |
|---|
| Further assuming a 25% shift to unemployment | 9.9 | 18.0 | 25.7 |
|---|
| Further assuming 50% shift to unemployment | 11.5 | 19.6 | 26.2 |
|---|
|
| More pessimistic, assuming a loss of 24 million workers | 10.6 | 21.5 | 33.0 |
|---|
| Further assuming a 25% shift to unemployment | 13.4 | 24.1 | 33.8 |
|---|
| Further assuming 50% shift to unemployment | 16.0 | 26.6 | 34.6 |
|---|
Source: Authors’ calculations from the Current Population Survey. Estimates are in the thousands and are not seasonally adjusted.Source: Authors’ calculations from the Current Population Survey. Estimates are not seasonally adjusted.
1 The “U6” rate includes all individuals who are unemployed, marginally attached to the labor force, or part-time for economic reasons, as a percentage of the labor force plus the marginally attached.
2 The “U-Cov” rate includes all individuals who are unemployed, out of the labor force but want work, on unpaid leave, or part-time for economic reasons, as a percentage of the labor force plus those who are not in the labor force but want work.Notes: Estimates are the monthly percentages of total employed or unemployed (as listed), seasonally adjusted. “PTER” refers to those who are part-time for economic reasons.Notes: The “U3” unemployment rate is measured as a percentage of the labor force; the “U6” underutilization rate is measured as a percentage of the labor force plus those identified as “marginally attached” to the labor force; and the “U-Cov” underutilization rate is measured as a percentage of the labor force plus those identified as out of the labor force but wanting work.


1 comments:
Jump into action—play the most intense online games today Hawkplay
Post a Comment