

But the issue that dogs them is student debt. JL
Nick Maggiuli reports in Of Dollars and Data:
Millennials own about 5% of all wealth, which is lower share than what prior generations owned around the same age. (But) millennials seem to be on the same general path as GenX and Baby Boomers were on when they were at the same age. In fact, Millennial wealth seems to be approaching Baby Boomer wealth (at least on a per capita basis) given that the red line (Millennials) is reaching out to the blue line (Baby Boomers) like it’s going to touch it in a few short years.“Millennials are much poorer than their parents”
“Millennials Just Became the Poorest Generation in History”
“Millennials Don’t Stand a Chance”
Unfortunately, articles like this tend to focus on the fact that Millennials own about 5% of all wealth, which is lower share than what prior generations owned around the same age. I don’t disagree with this, but it doesn’t paint the full picture. Because when you look across the standard wealth/income metrics, Millennials seem to be on (more or less) the same path as prior generations.
How Millennials Are Similar to Prior Generations
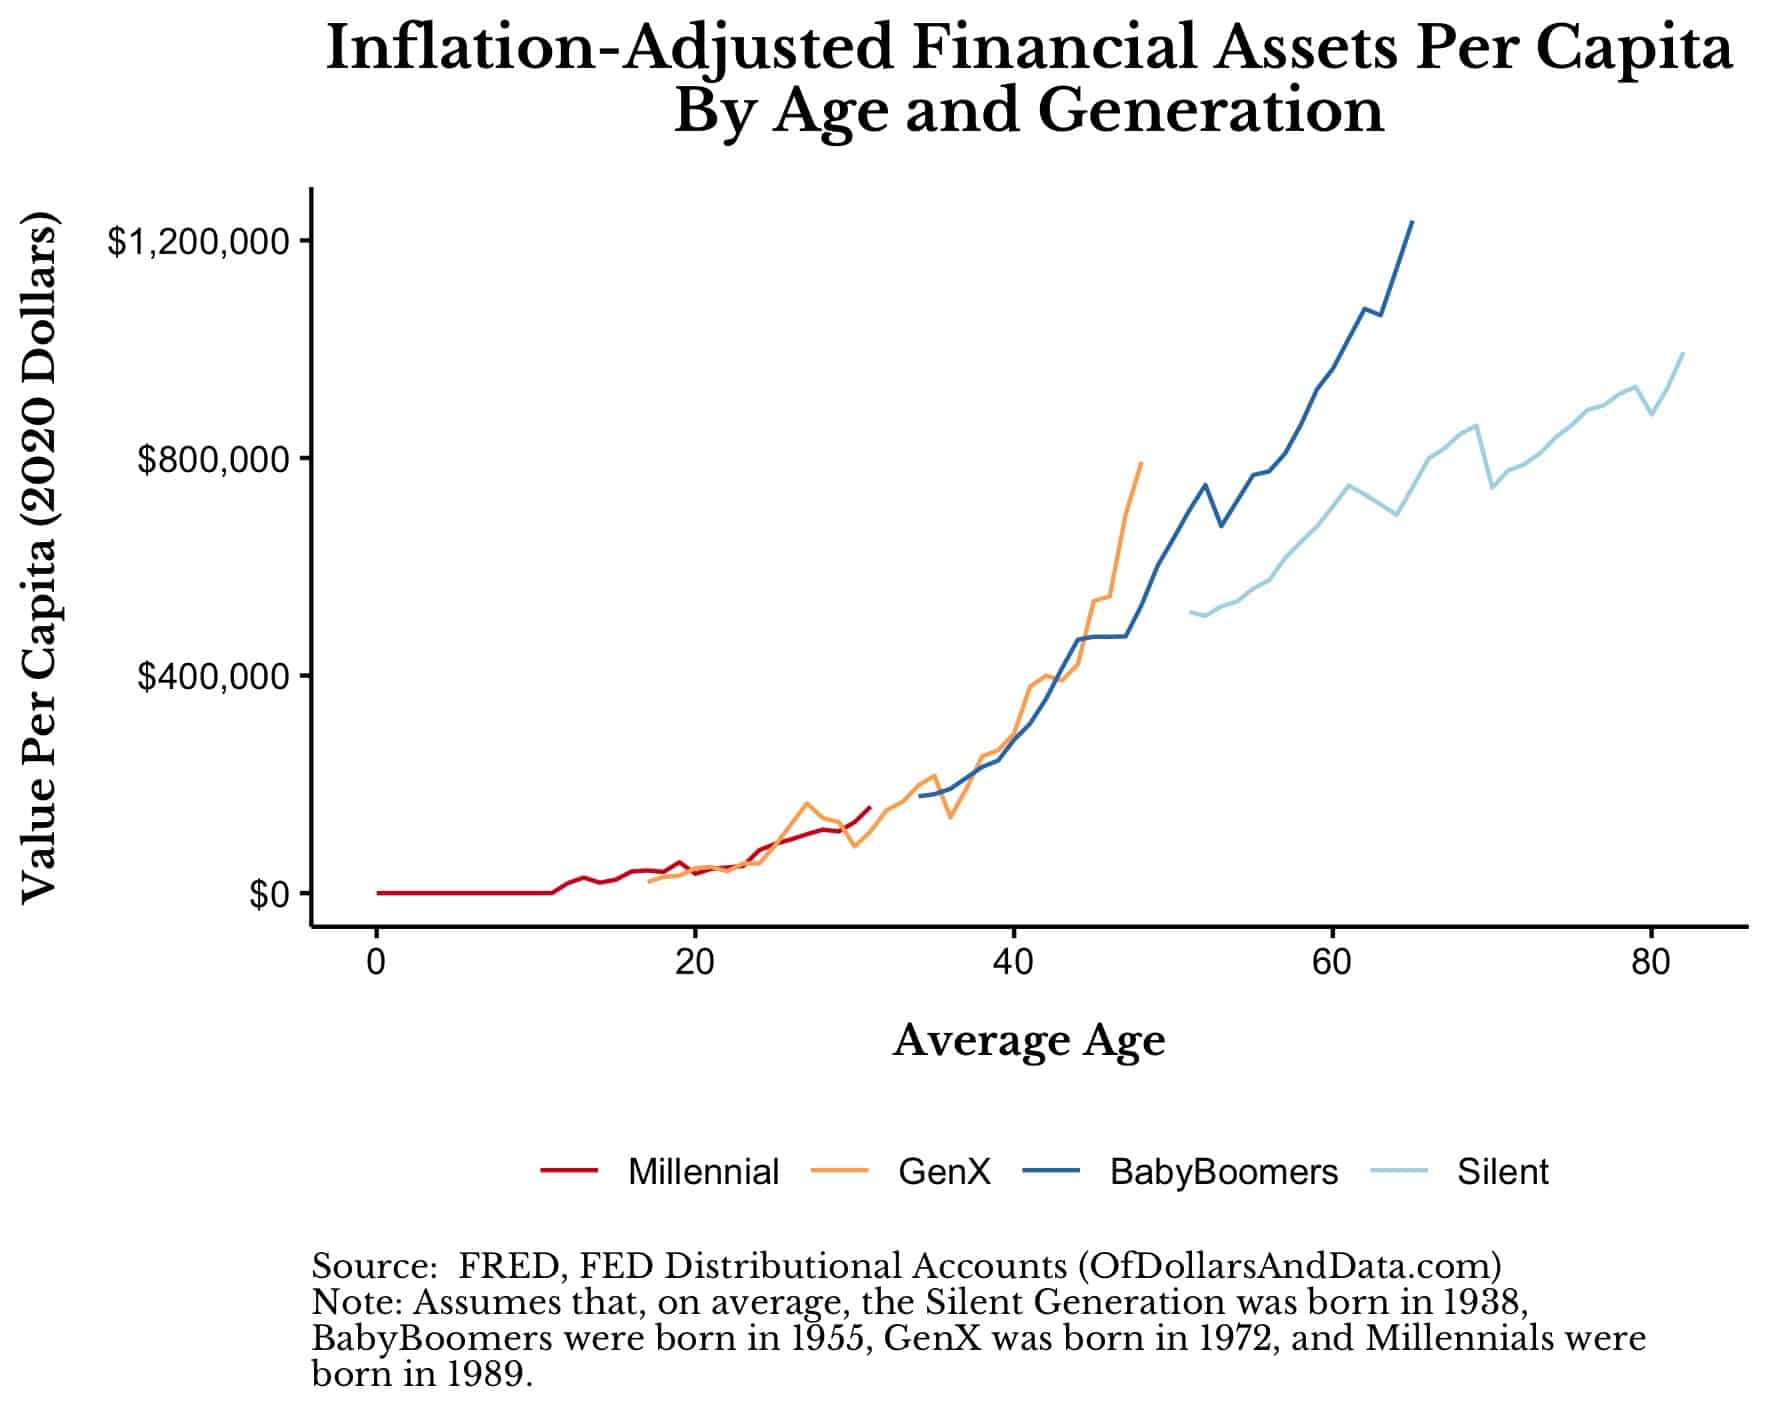
Using the same Federal Reserve data cited in the articles above, we can see that Millennials have roughly the same inflation-adjusted financial assets per capita as prior generations did around the same age. In the chart below I illustrate this by aligning the average age of each generation (as defined by the Federal Reserve) and then showing the inflation-adjusted financial assets after dividing by the number of households in each generation:
As you can see, Millennials seem to be accumulating financial assets at the same rate that GenX and Baby Boomers did. Of course, financial assets aren’t the only metric that matters, so let’s look at total net worth (assets – liabilities) as well.
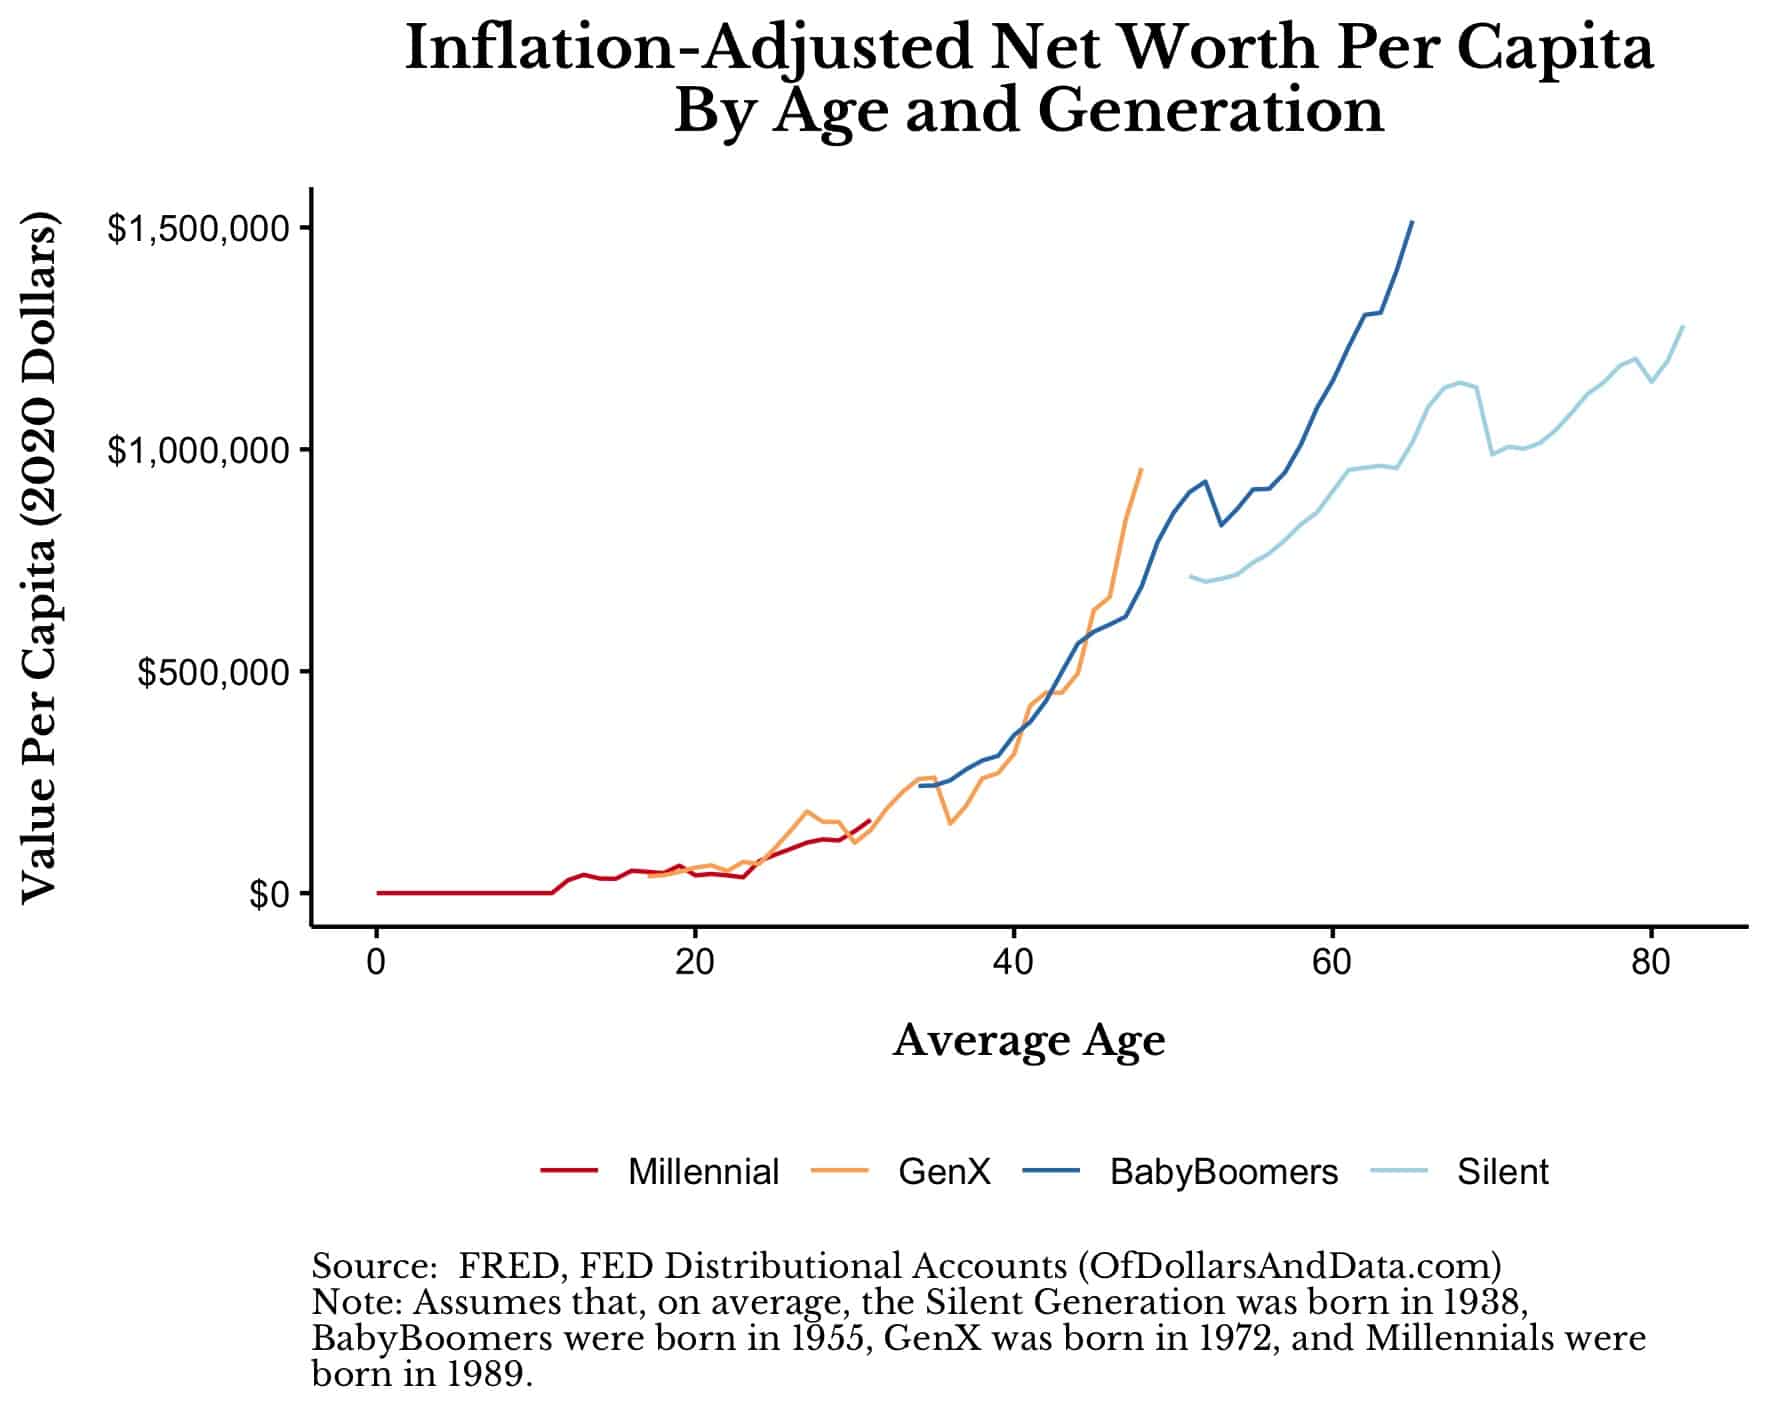
Once again, after adjusting for inflation and the number of households in each generation, Millennials seem to be doing fine in terms of total net worth too:
Looking at this chart, Millennials seem to be on the same general path as GenX and Baby Boomers were on when they were at the same age. In fact, Millennial wealth seems to be approaching Baby Boomer wealth (at least on a per capita basis) given that the red line (Millennials) is reaching out to the blue line (Baby Boomers) like it’s going to touch it in a few short years.
It reminds me of that famous painting of Adam and God touching fingers:
Jokes aside, Millennial wealth seems to be on a similar trajectory as those generations that came before. For example, from Q4 2019 to Q4 2020 (during COVID!), Millennials added over $1 trillion in total net worth, which is a 20% growth rate in wealth.
If their wealth continues to compound at this rate for the next three years, they will easily surpass what Baby Boomers had at the same age. In fact Millennials only need a 13% growth rate in their per capita wealth over the next three years to match Baby Boomer per capita wealth at the same age. I don’t think this is unreasonable to beat either since GenX had a 22% annual growth rate in per capita wealth from ages 31-34 (the same average age as Millennials are now).
Either way, this data suggests that the narrative around Millennial wealth isn’t as extreme as the media makes it out to be. But, the same thing is true if we examine income.
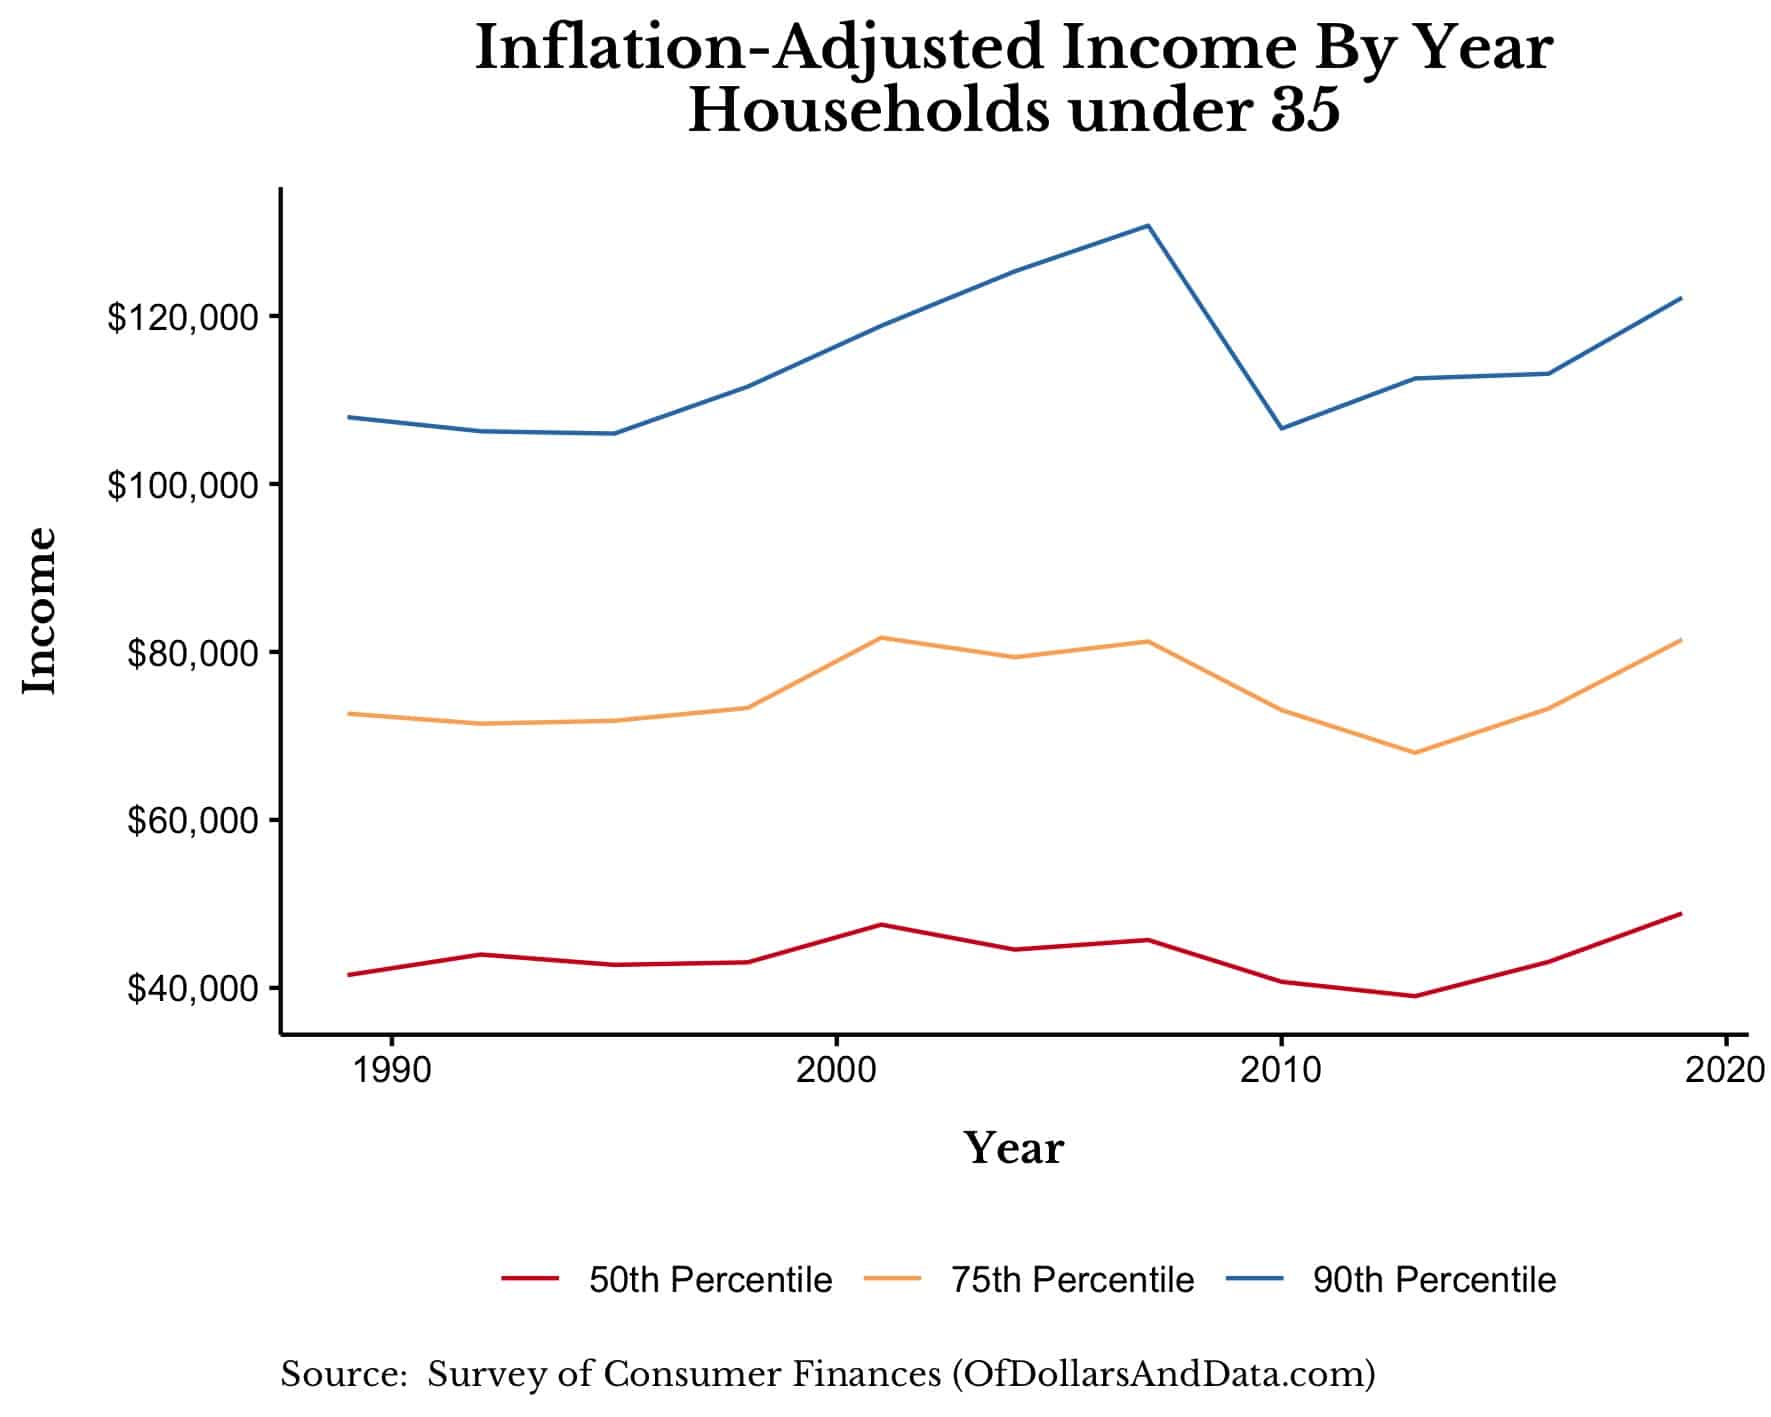
For example, for households under age 35, incomes have gone up across the income spectrum since when this data starts (1989). Here is the 50th, 75th, and 90th percentiles of income for these younger households over time:
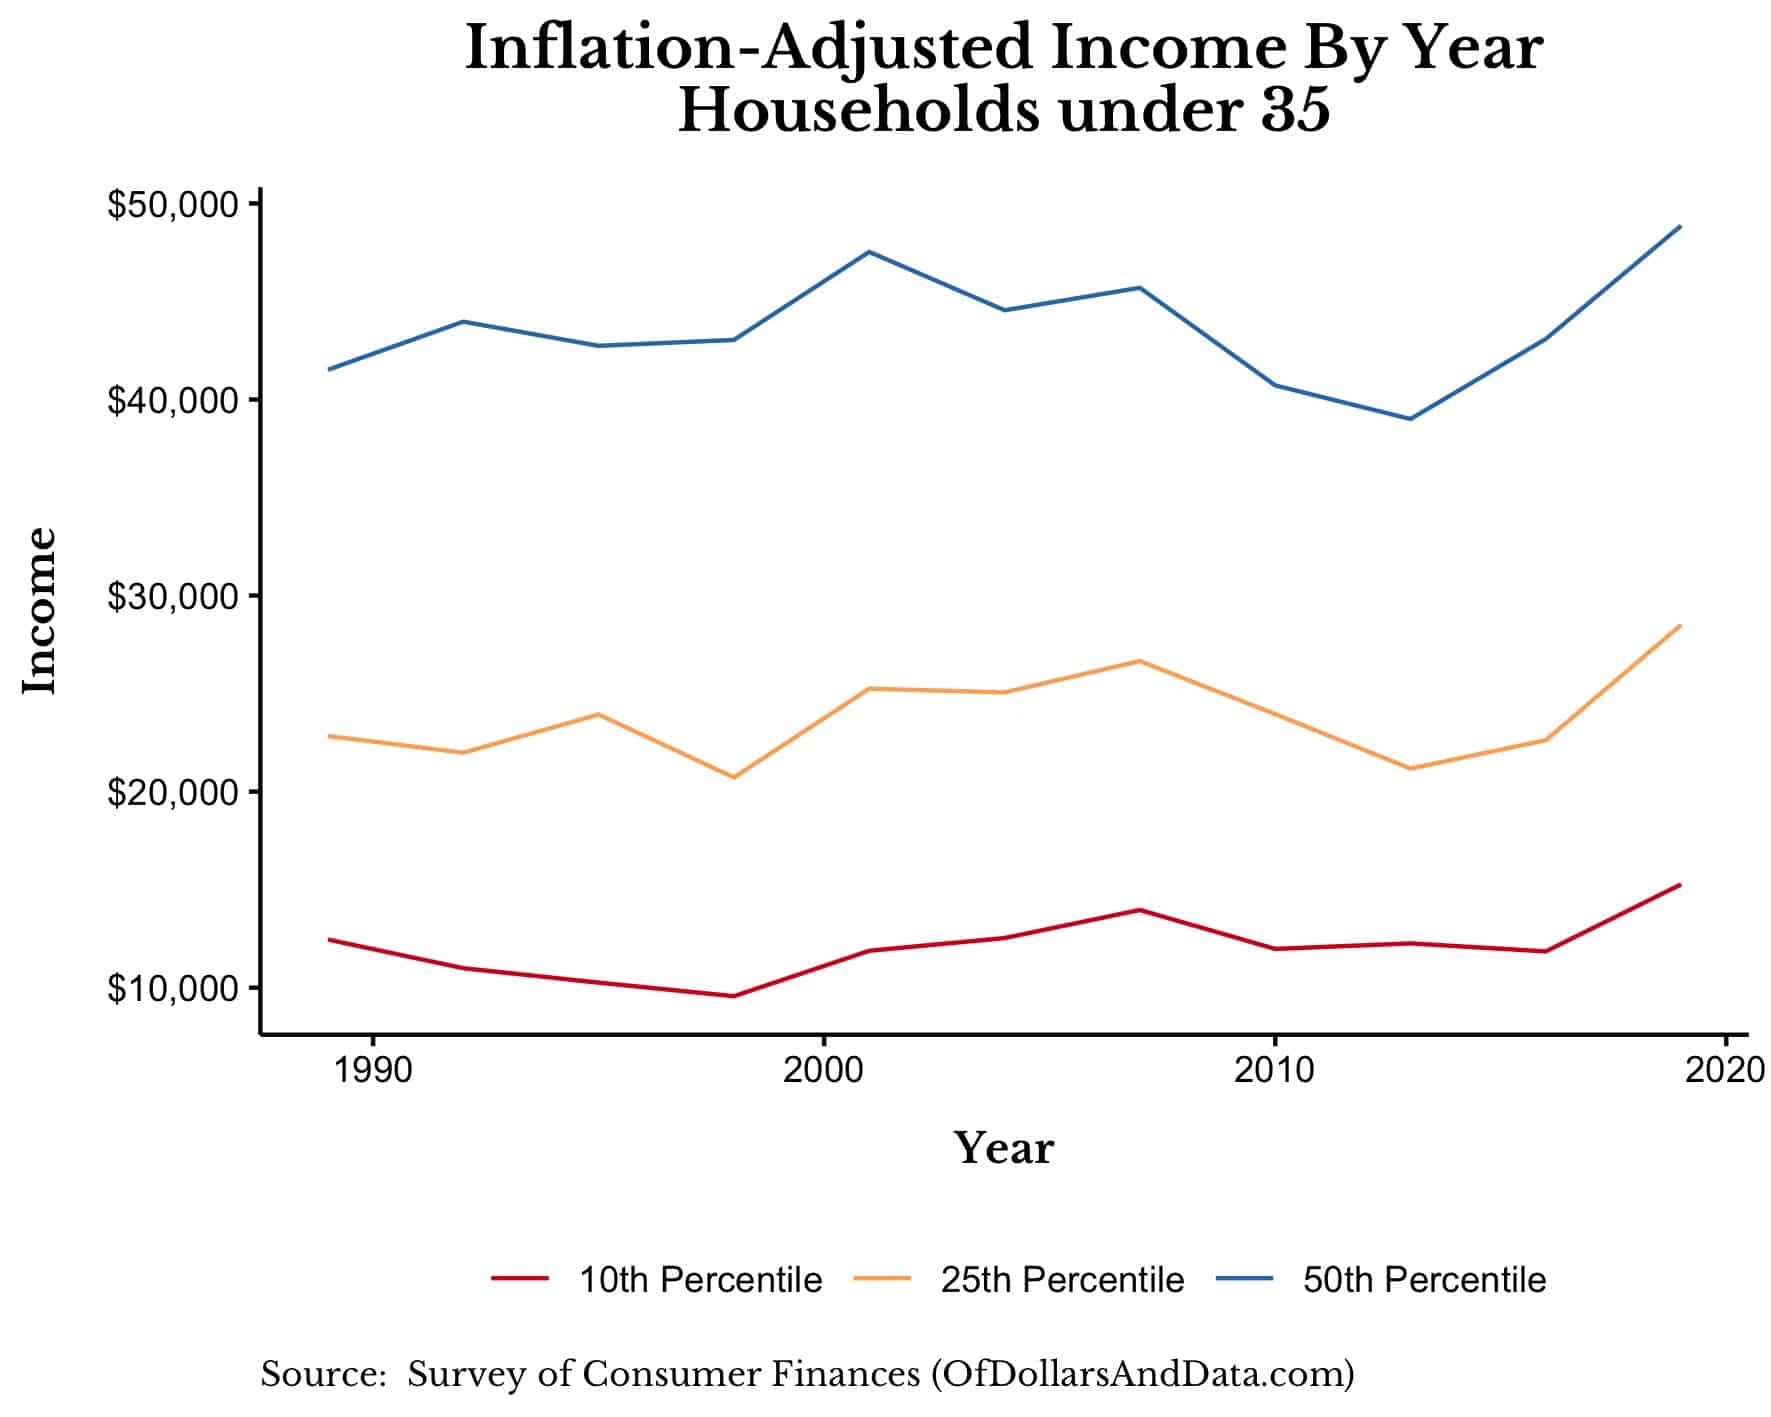
And if we look at the 10th-50th percentiles (the lower end of the spectrum) we see the same thing:
Though the 90th percentile of income earners seem to have lower incomes today than in 2007, across the rest of the income spectrum, incomes are slightly higher today.
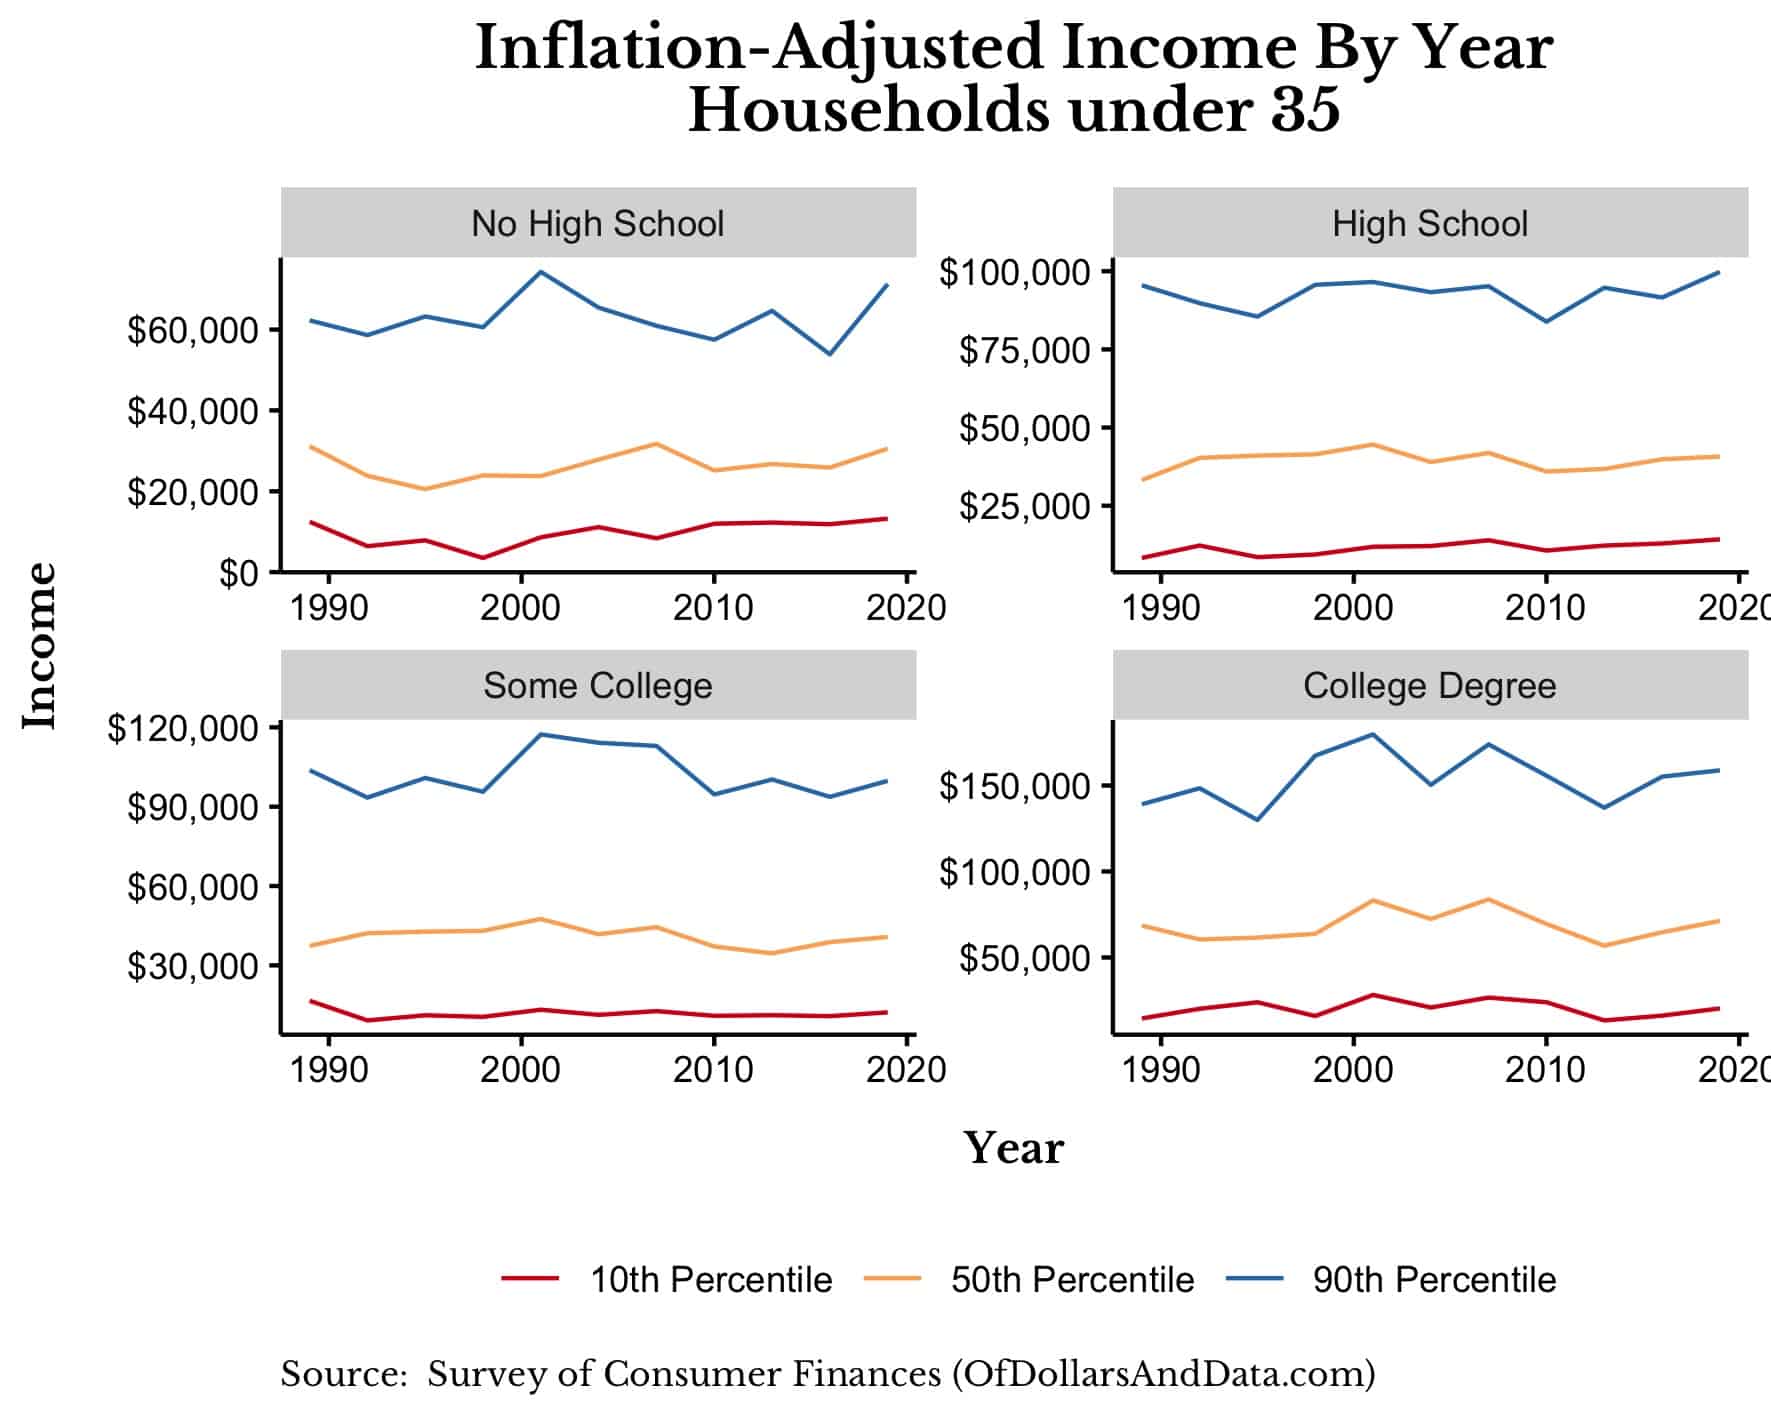
Of course, you might argue that these higher incomes are due to Millennials having more education, but even when we break this out by educational attainment we still see slight increases over time. Below is a chart of the 10th, 50th, and 90th percentiles of income broken out by educational attainment for all households under 35:
As you can see, Millennials of all education levels generally have higher inflation-adjusted incomes today than 30 years ago. Unfortunately, these higher incomes have been eaten up by higher living costs.
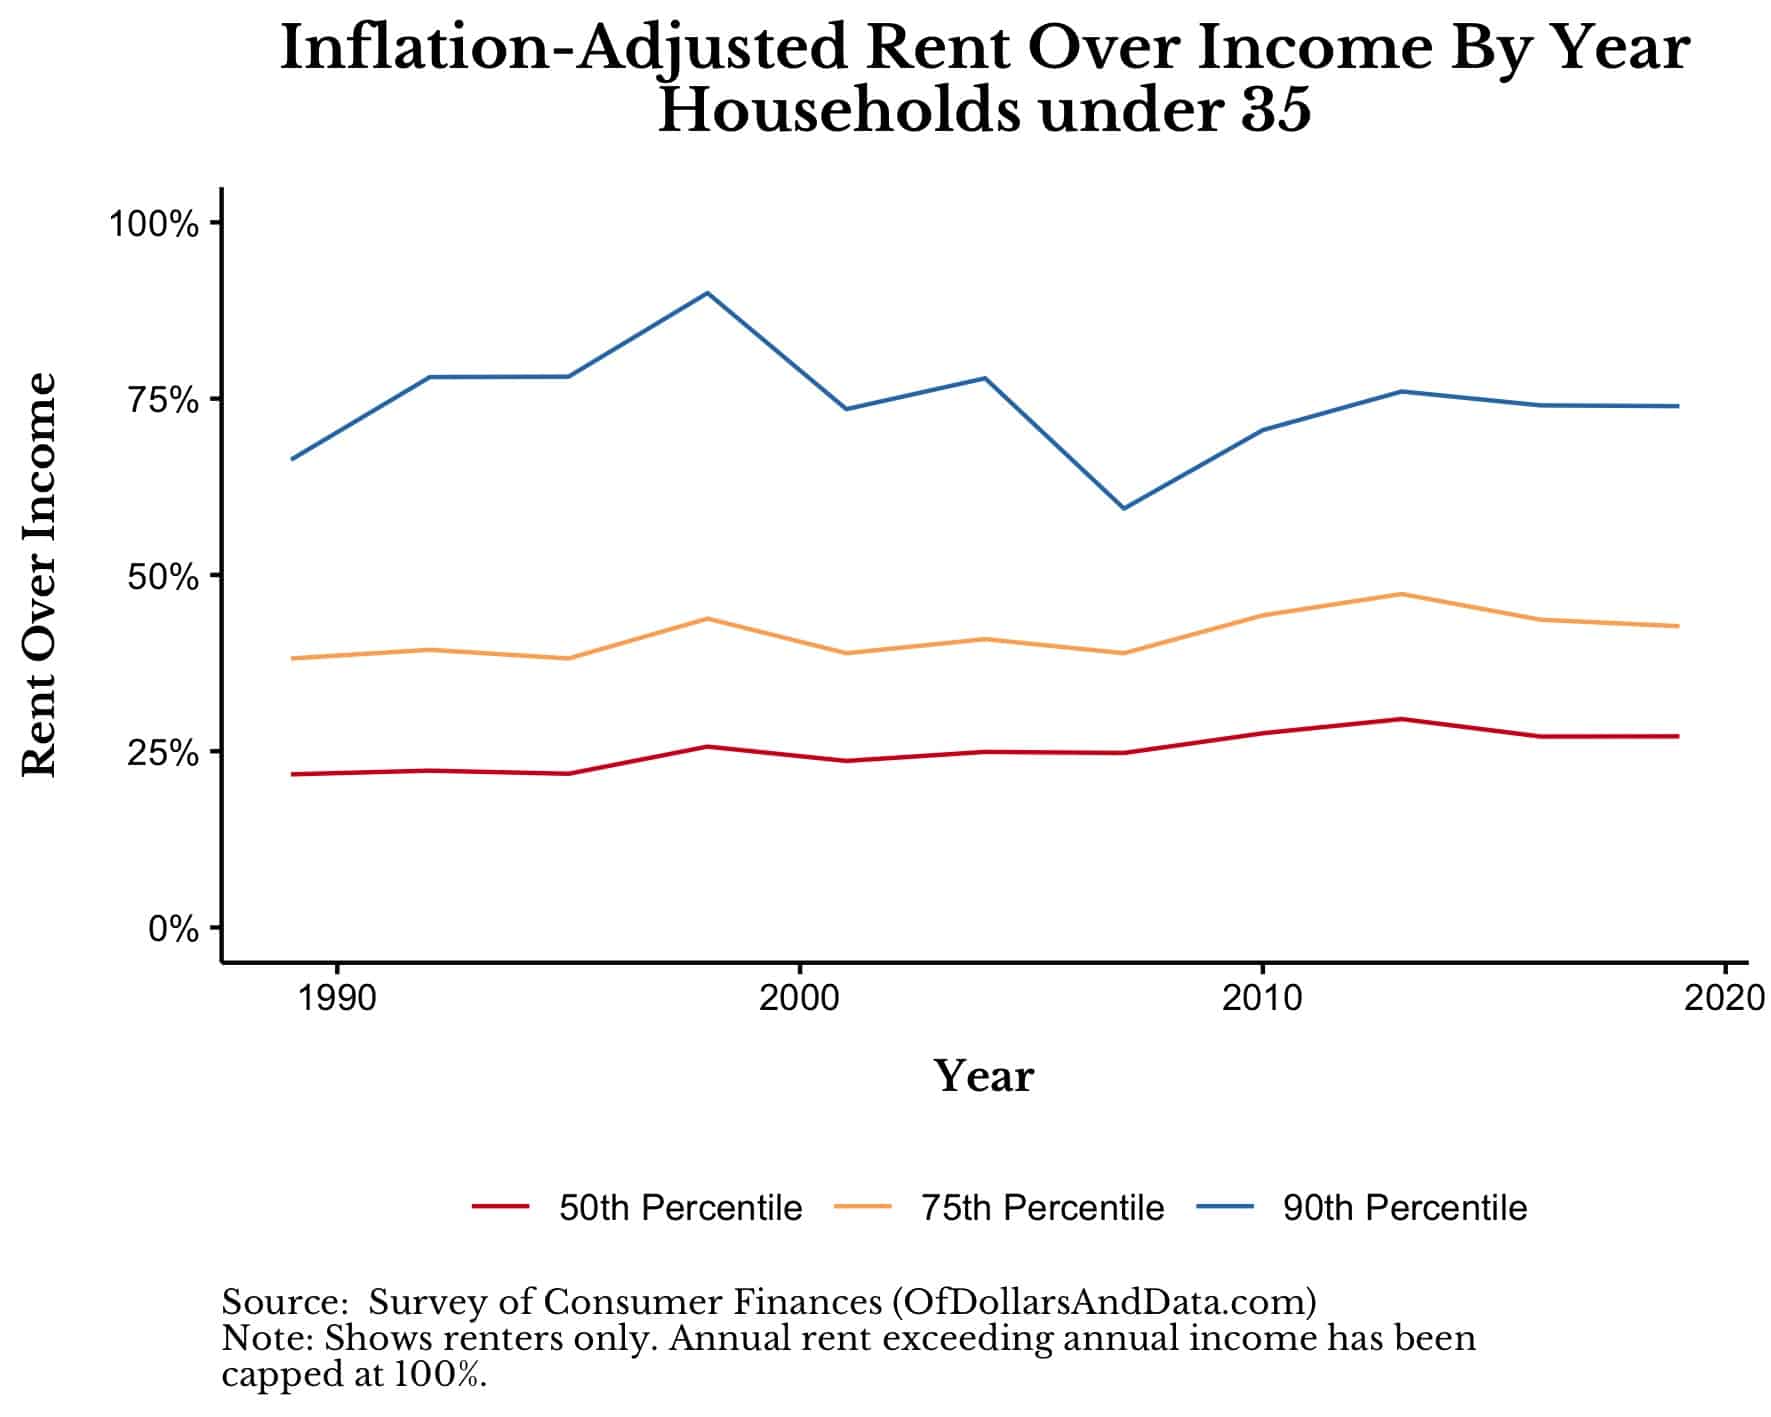
For example, if we look at annual rent over annual income for households under 35, we see that this ratio hasn’t gone down though incomes have gone up. The chart below shows the 50th, 75th, and 90th percentile of the ratio of annual rent over income for young renting households over time:
From this chart I would say that the ratio of rent over income has increased slightly, but not significantly for younger households. In this regard, Millennials and prior generations seem to have had a similar experience.
Whether we look at wealth or income statistics, I don’t see an entire generation in crisis. In fact, Millennials seem very similar to prior generations on many dimensions. Unfortunately, Millennials are still reported to be doing much worse than prior generations. So what’s going on? Well, there is one major area where Millennials do look quite different than generations of the past.
Why Do Millennials Seem to Be Doing So Much Worse?
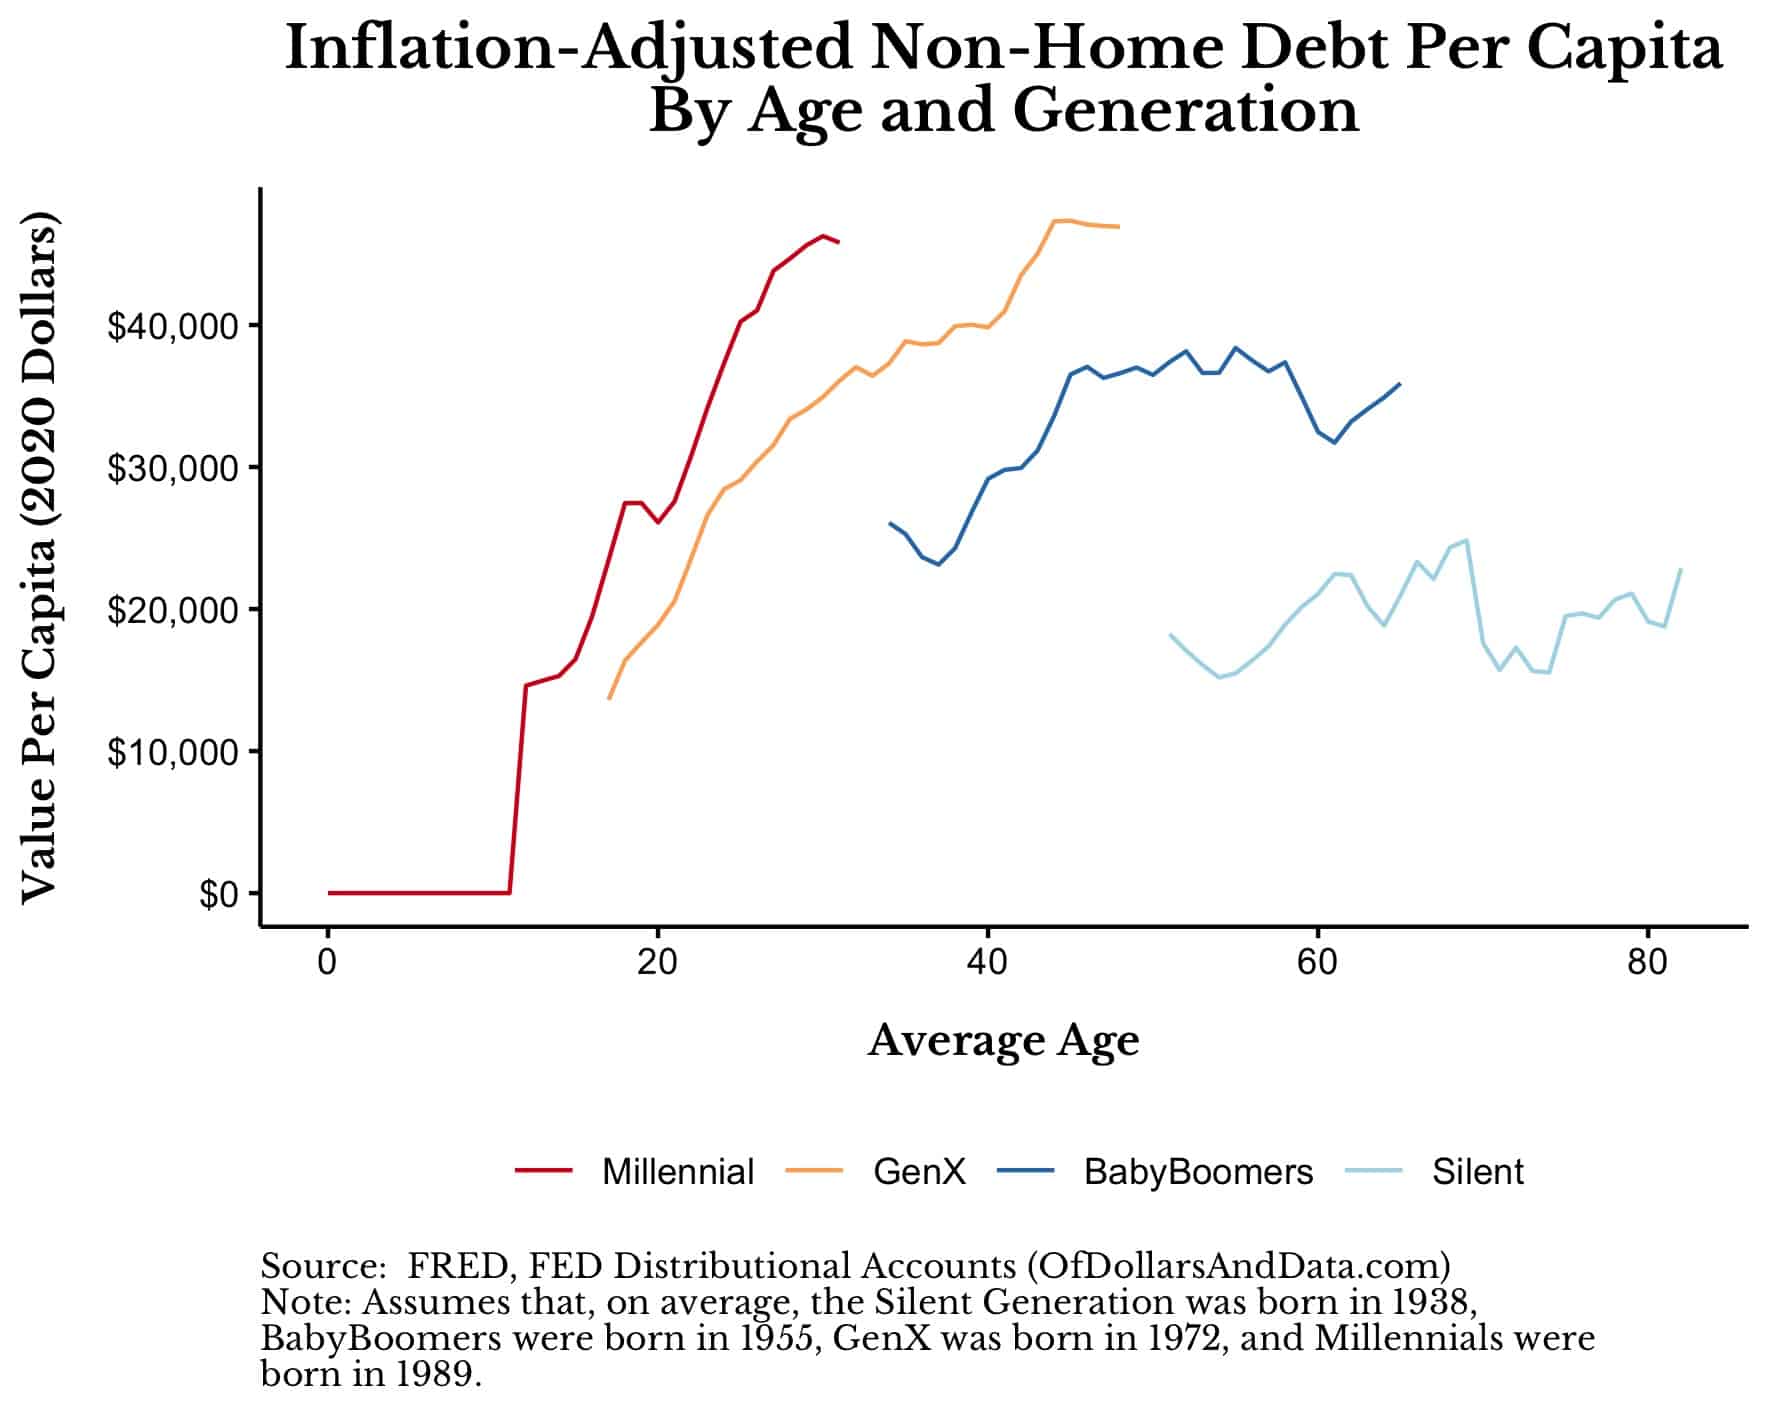
Though wealth and income are mostly similar between Millennials and prior generations, when it comes to debt that’s where things are a bit different. Non-mortgage debt held by Millennials is significantly higher than Baby Boomers and seems to have been accumulated at an earlier age than prior generations:
This is one metric is where Millennials have it objectively worse than Baby Boomers, but not necessarily than GenX. However, even this doesn’t tell the full story because that debt isn’t evenly distributed across all Millennials.
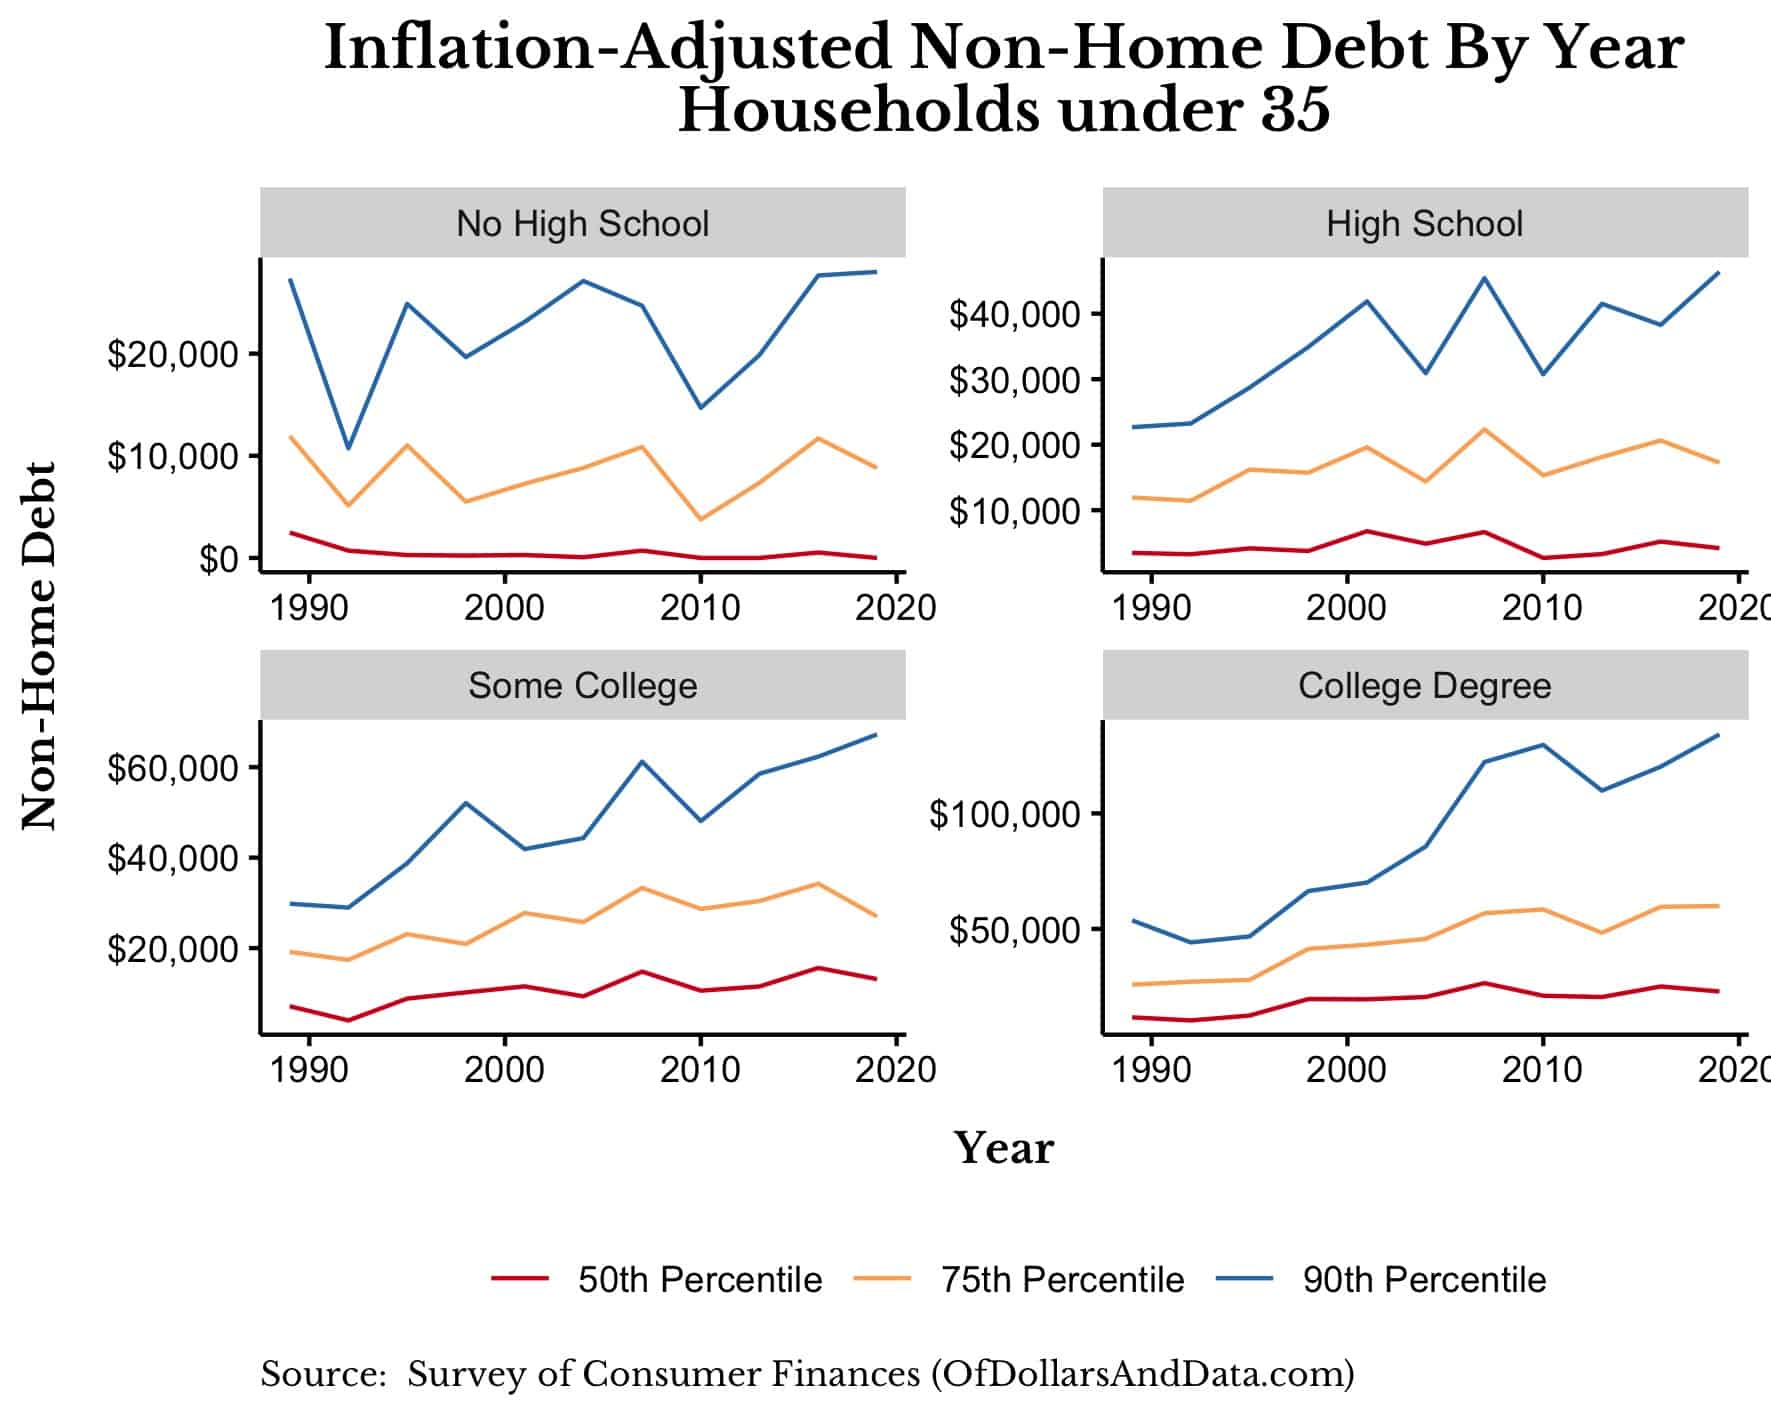
In fact, if we look at households under age 35 over time, we can see that non-mortgage debt loads increased significantly, especially among households with at least some college experience.
The chart below illustrates this by plotting the 50th, 75th, and 90th percentile of non-mortgage debt for younger households over time broken out by educational attainment:
As you can see, for non-college households, non-mortgage debt hasn’t changed all that much over time except at the highest end. However, for households with any college exposure, non-mortgage debt seems to be up across the board. This makes sense given the increasing amount of student loans taken out by this cohort of households.
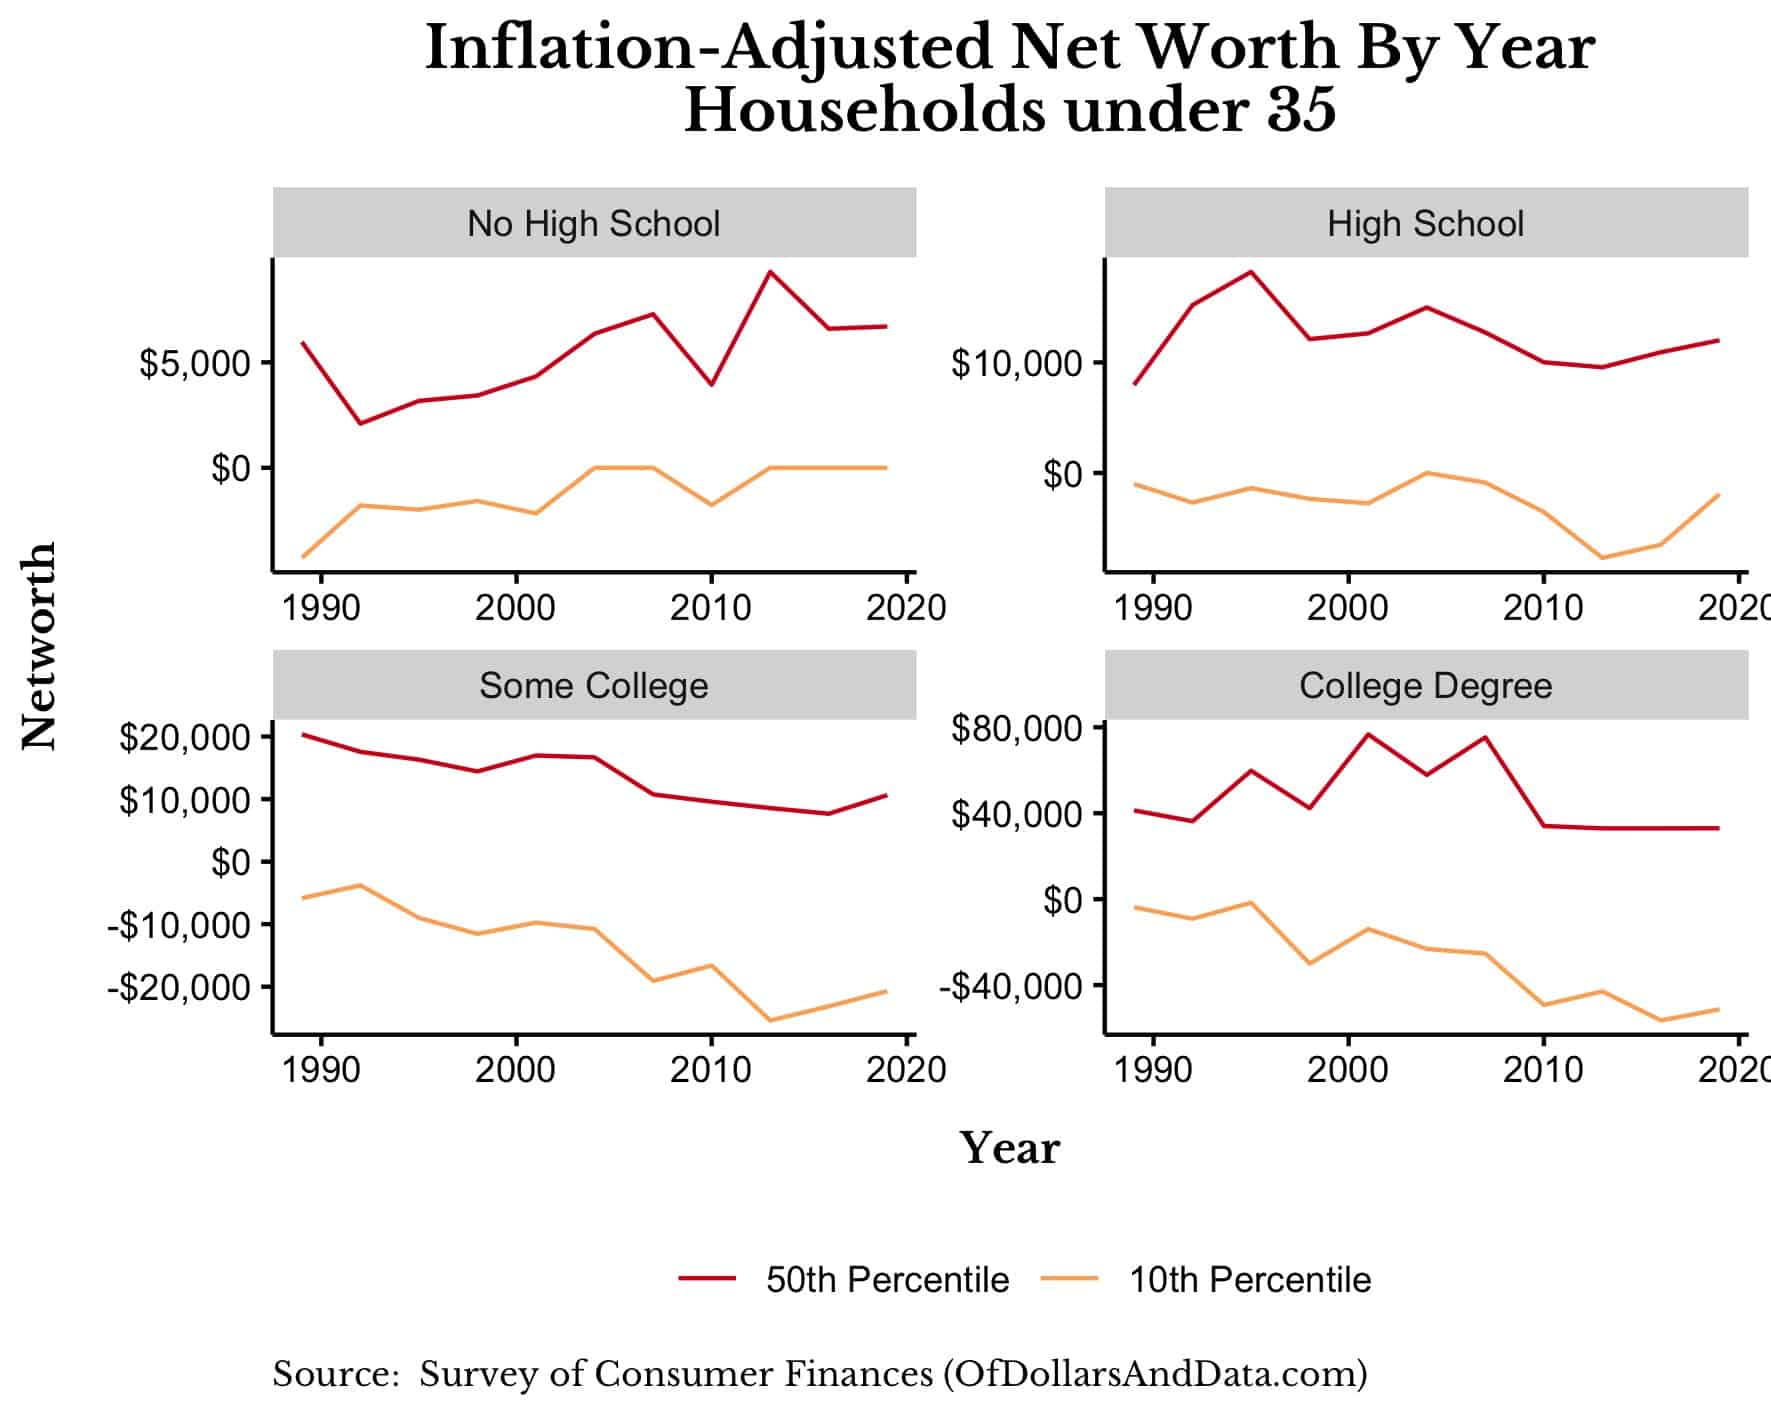
And if you look at the net worth broken out by educational attainment, you can see that net worth has dropped the most among younger households with college exposure on the lower end of the wealth distribution (i.e. the 10th percentile):
As you can see, while net worth is basically the same among households with no college exposure, there has been a significant decline among those with any college exposure, especially at the lower end.
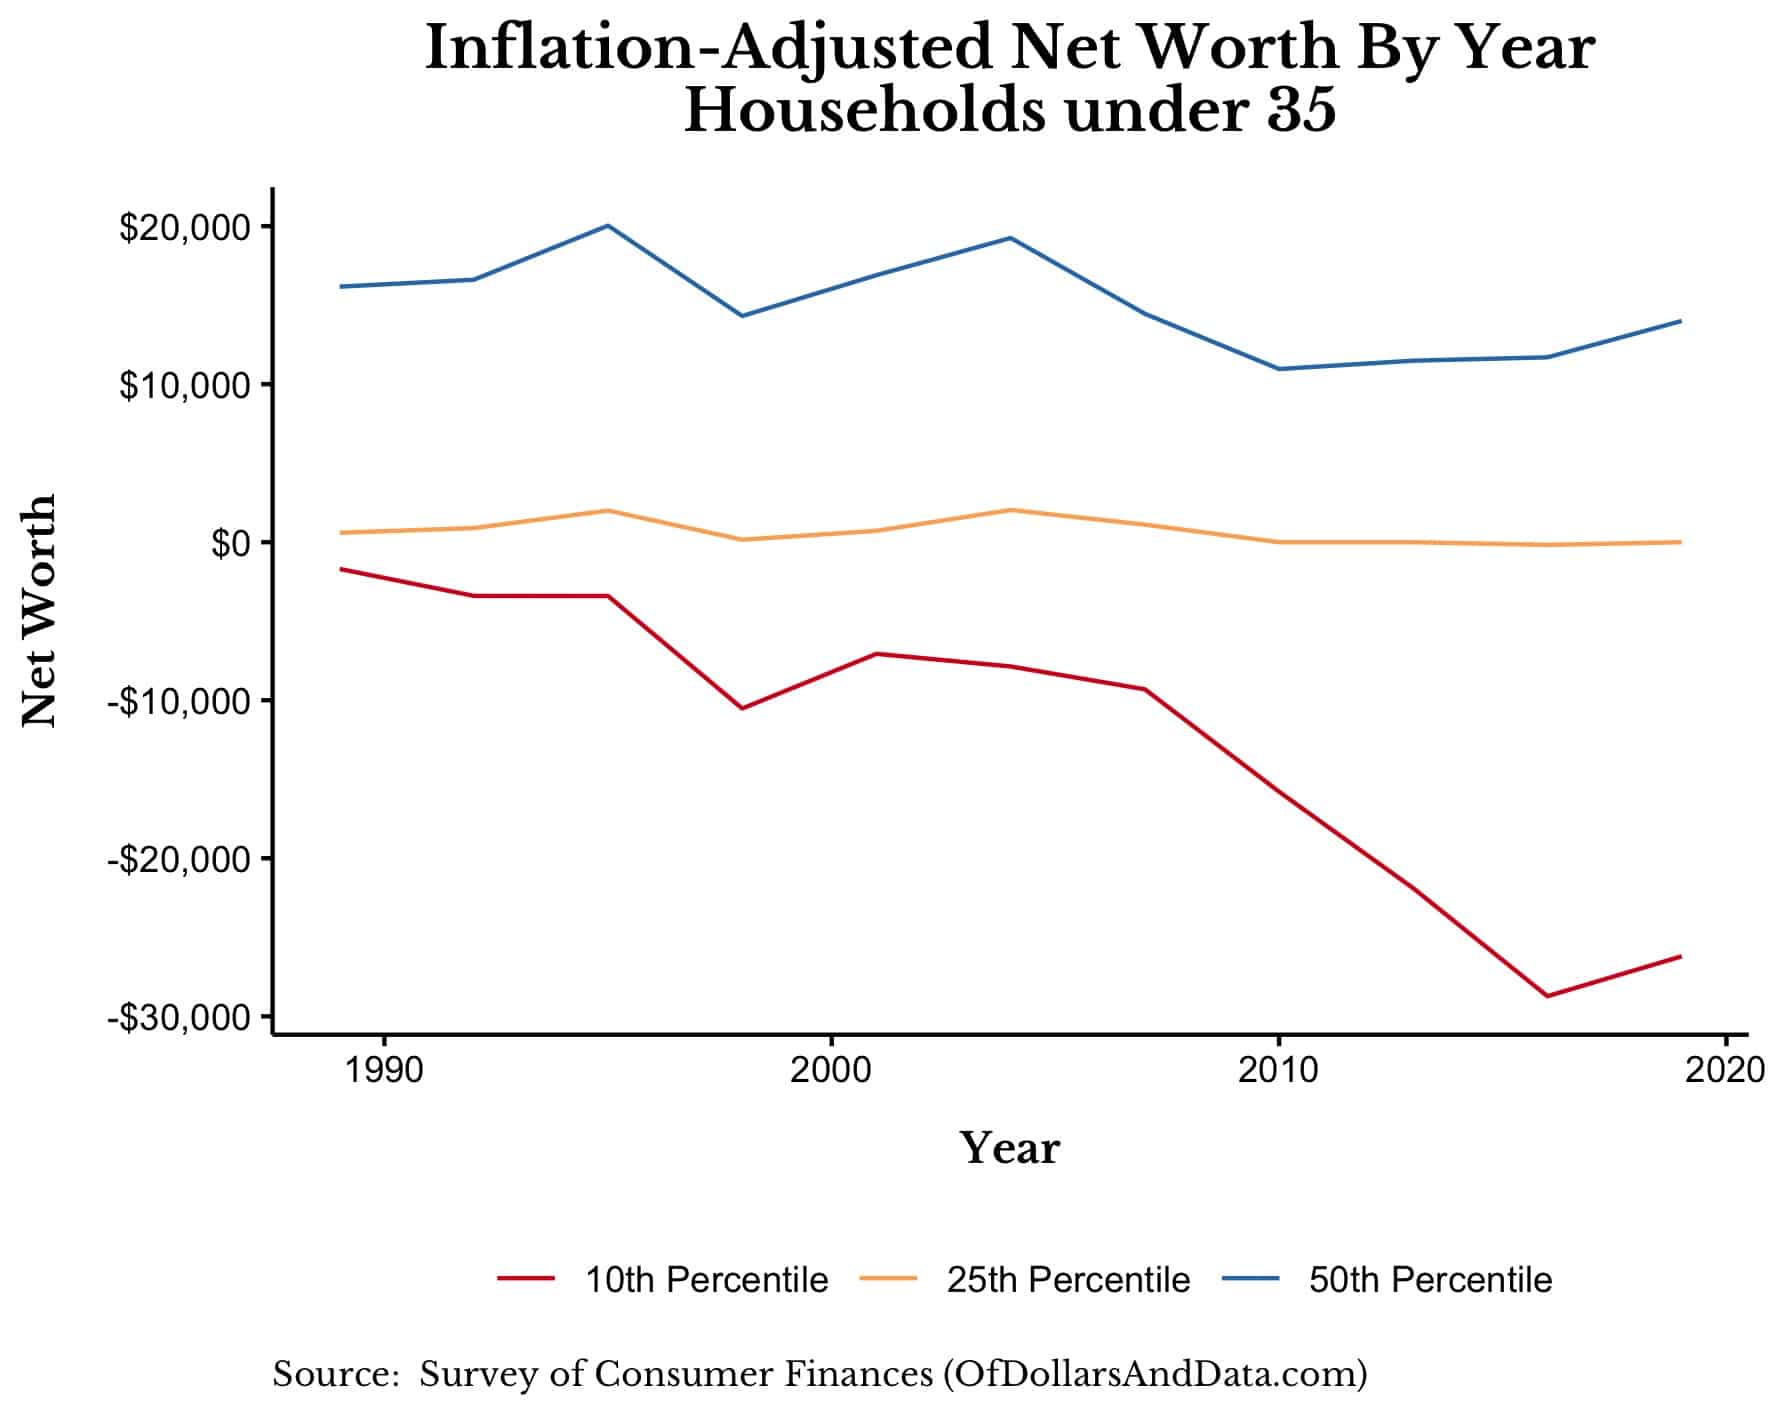
On aggregate, we can see this most clearly by looking at the change in net worth among the poorest younger households over time:
While the 25th and 50th percentile of younger households show a similar level of net worth over time, the bottom 10 percent of younger households have seen a huge decrease in wealth. This is what seems to be driving the media narrative that Millennials are poorer than everyone else—selection bias.
We don’t hear about all the succeeding Millennials, only those who struggle. If a Millennial came out tomorrow and tweeted about how well they were doing they would get crushed with “sick brag bro” and “weird flex, but okay” comments for hours. As a result, they don’t discuss their triumphs publicly. This is how a smaller portion of mostly educated, highly indebted households become the narrative. While their stories are important to tell, they aren’t the typical Millennial experience.
I emphasize this point because by overlooking it you can send the wrong message. By suggesting that all Millennials can’t get ahead, you are painting the entire generation as victims of unfair circumstances. This is true for some Millennials, but not all Millennials. The distinction is important because it influences how policy makers (who are mostly Baby Boomers) think about these issues.
When you are under the impression that all Millennials can’t get ahead, any sort of policy targeted to help younger people is seen as a massive transfer across generations. But it shouldn’t be seen that way. Because most Millennials (myself included) don’t need any sort of help to make it in America. However, some of us do.
Millennials that have been burdened with negative amortizing loans, six figure loan debts, and subpar employment prospects need help. Whether that means some sort of partial loan forgiveness, tax credits, or something else entirely, a remedy is in order. Our narratives should focus on this subset of the Millennial generation and what we can do to help them rather than saying that all Millennials can’t get ahead.
This is why I don’t believe Millennials are the “poorest generation ever” though we do have some of the poorest (most indebted) individuals in American history. Recognizing this is the first step towards actually improving their situation. Thank you for reading!
Before You Trash This Article, Read This
In writing this piece I found some research that goes against some of the arguments I made here and I want to address those claims. In particular, the piece Are Millennials Different? states:
Millennials are less well off than members of earlier generations when they were young, with lower earnings, fewer assets, and less wealth.
These findings are in stark contrast to my charts above. How do I explain this? Most of this seems to be time period selection bias, which the researchers could not avoid. For example, when they examined income (see their Table 1), they look at Millennial income in 2014. However, in 2014 incomes were still severely depressed from the Great Financial Crisis (the worst economic decline since the Great Depression).
If you compare Millennials at this low point to prior generations, it will skew your conclusions. Even the charts I produced above would verify this, if you ended them in 2013/2016. However, in the past five to six years, Millennial incomes have increased substantially to the point where the gap doesn’t seem to be as significant as it once was.
When it comes to how they compared wealth, I’m not convinced the researchers used the right age cohorts between Boomers and Millennials. For example, in 1989 Boomers had an average age of 34, but in 2016 Millennials had an average age of 27. Seven years may not seem like much, but it can have a huge impact on aggregate wealth statistics. If they re-ran their analyses with data through 2020, I’m convinced that their conclusions would be more inline with what I’ve stated here.
Lastly, want to give a special shoutout to a fellow R finance nerd for helping me analyze some of the data in this piece.


0 comments:
Post a Comment