Covid Has Become the 3rd Leading Cause Of Death In the US
Exceeded by only heart disease and cancer, the effects of both of which it can exacerbate. JL
Youyou Zhou and Gary Stix report in Scientific American:
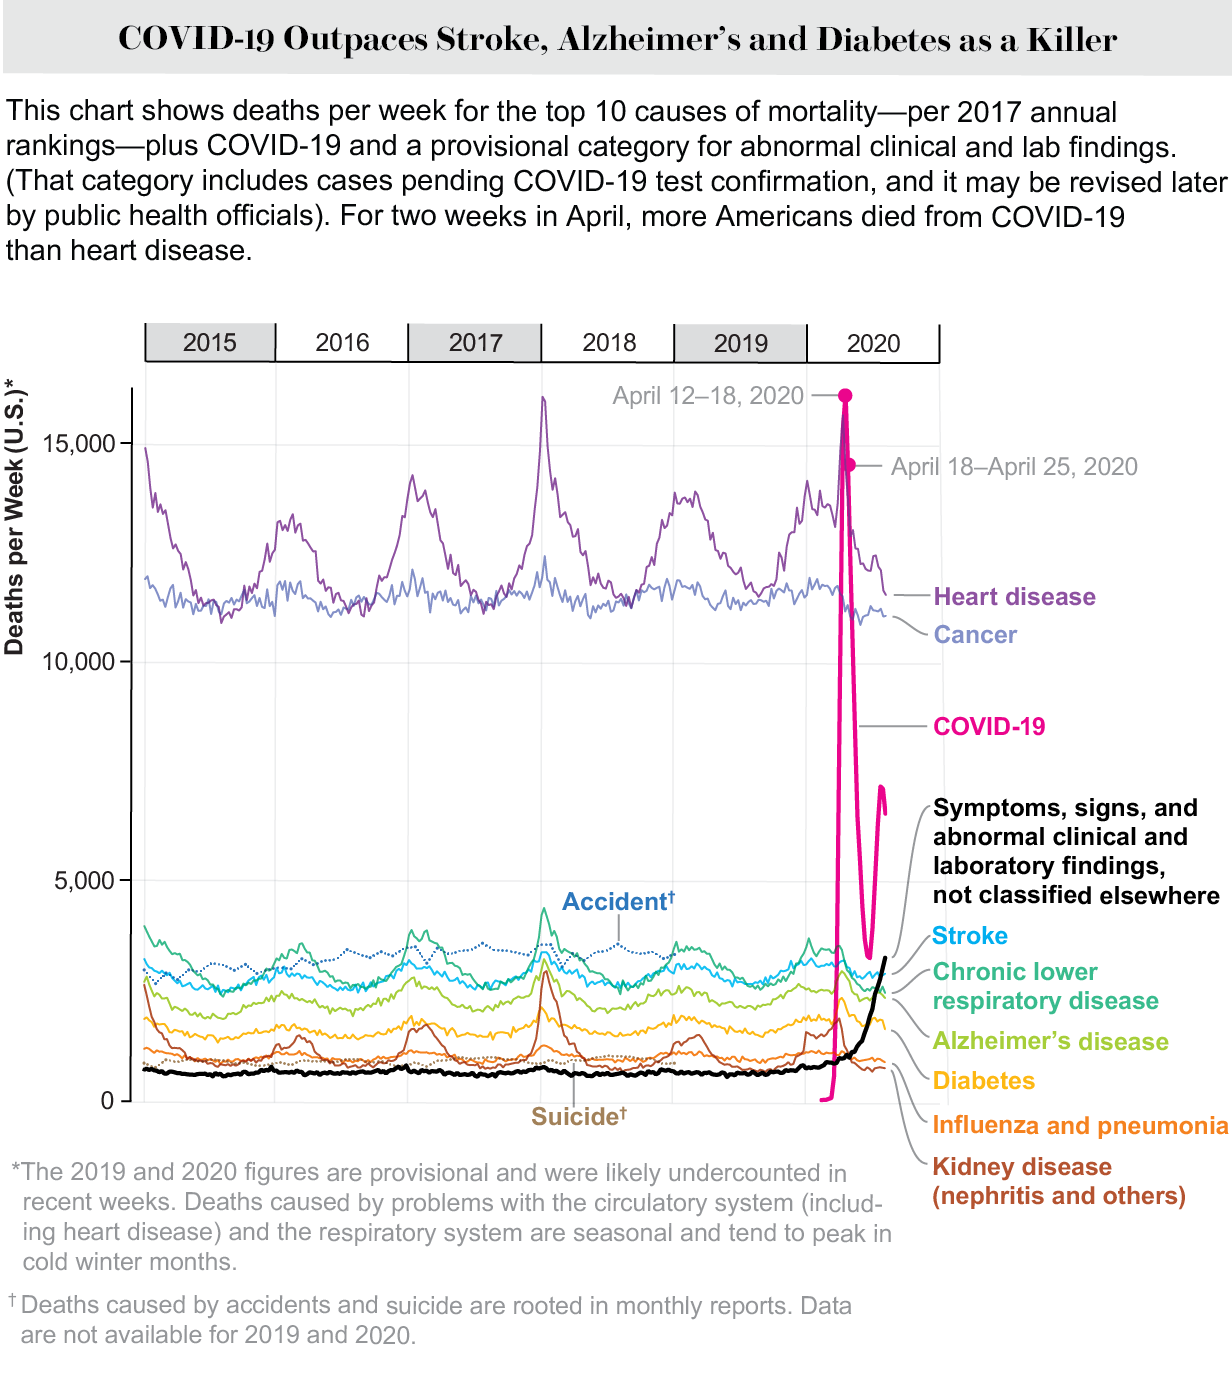
COVID-19 became the third biggest cause of deaths, trailing heart disease and cancer. It killed more people
than stroke, chronic lower respiratory disease, Alzheimer’s, diabetes,
kidney disease or influenza. The disease (became) the third deadliest in May, and has stayed there since.The human toll is a number as big
as the population of Salt Lake City or Birmingham, Ala.—and greater
than the deaths in any U.S. conflict except for the Civil War and World
War II.
“It affects virtually nobody,” President Donald Trump said of the novel coronavirus on September 21—a few hours before U.S. deaths from COVID-19 exceeded 200,000 and less than two weeks before he tested positive. Unlike the president, the numbers don’t lie. The human toll underlying that milestone figure is a number about as big as the population of Salt Lake City or Birmingham, Ala.—and greater than the deaths in any U.S. conflict except for the Civil War and World War II.
The figures speak for themselves, andScientific Americantakes a deeper look here. COVID-19 became the third biggest cause of deaths in the week of March 30 to April 4, trailing heart disease and cancer. It killed more people than stroke, chronic lower respiratory disease, Alzheimer’s, diabetes, kidney disease or influenza. In that week, close to 10,000 people died of the illness caused by the coronavirus. The flu, which Trump and others have invoked when discussing COVID-19, led to 1,870 deaths (a figure that includes pneumonia) over the same time frame. A spike in the week-by-week accounting came in mid-April, when COVID-19 cases became the leading cause of death. The disease returned to the third deadliest spot in the week of May 4 to 9, and has stayed there since.
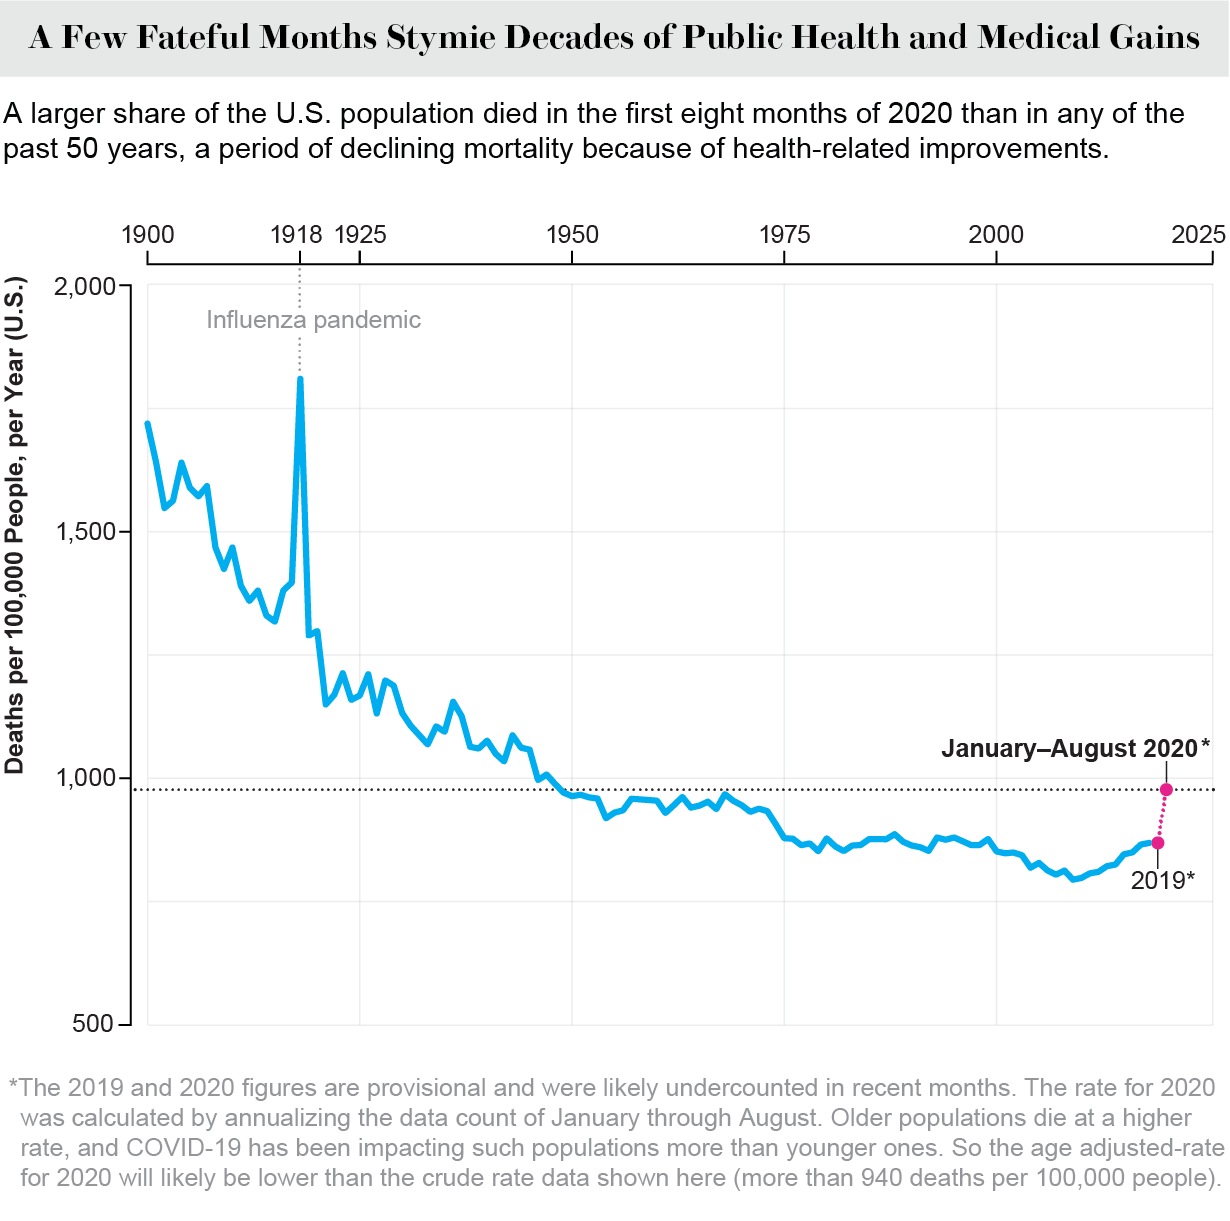
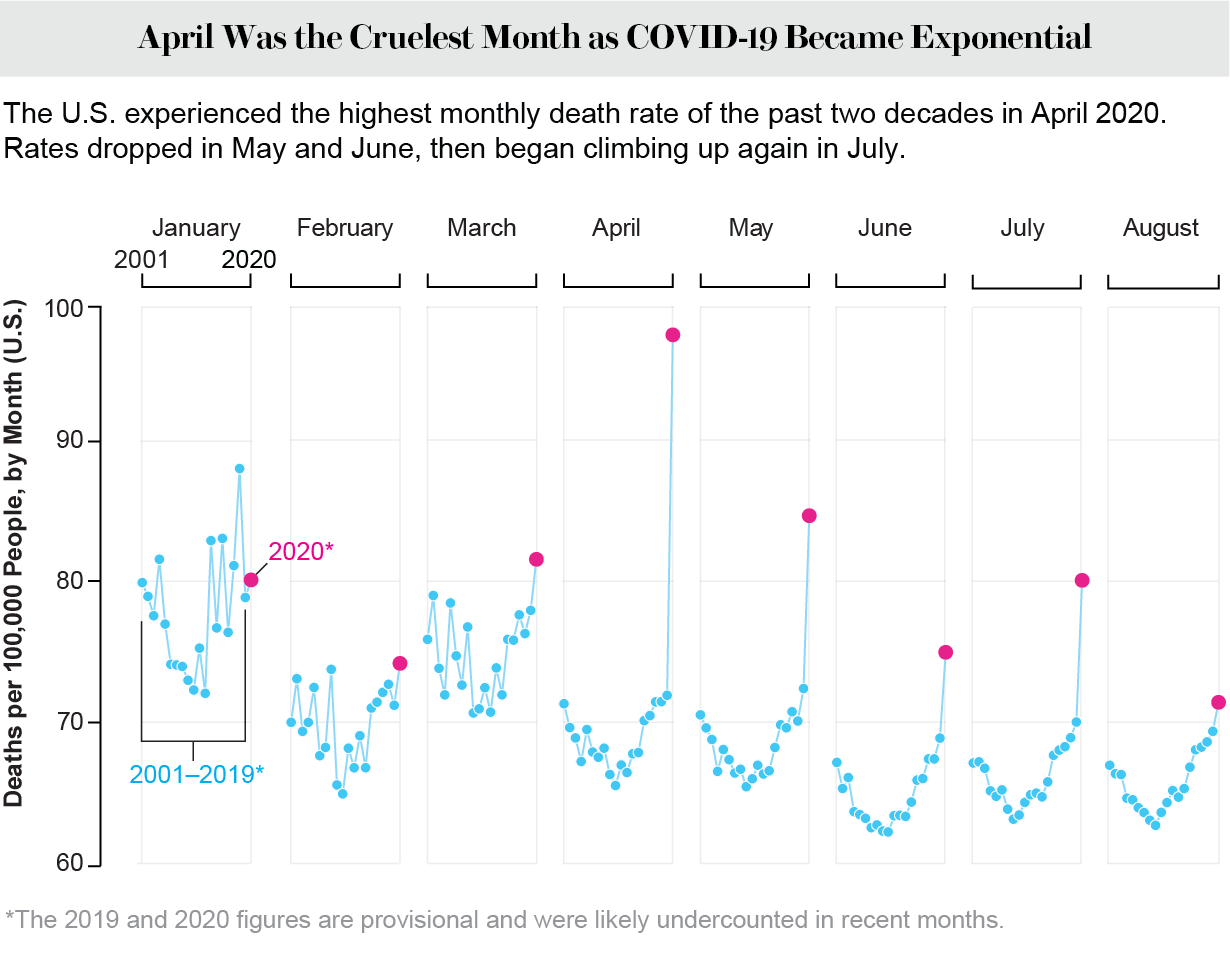
This profile of loss can be broadened further to measure excess deaths above typical mortality rates. Provisional death counts from the Centers for Disease Control and Prevention show that more people died every month from March to August this year than during the same period in the past 20 years. (The statistics include deaths from both the virus and upticks for other causes such as a lack of medical care as hospitals became overwhelmed.)
ADVERTISEMENT
COVID-19 marks at least a temporary setback for epidemiology. The share of Americans who died in the first eight months of this year was greater than that of any year going back to 1970—a year that paradoxically turned out to be a good one for public health. In 1970 President Richard Nixon signed the Occupational Safety and Health Act, put his signature on a bill to ban television and radio cigarette ads and sent to Congress a plan for setting up the Environmental Protection Agency. Maybe such actions can serve as precedents in years ahead when policymakers convene to plan for the inevitability of future pandemics.
Credit: Youyou Zhou; Sources: U.S. Census, Centers for Disease Control and Prevention, and National Center for Health Statistics
Credit: Youyou Zhou; Sources: U.S. Census, Centers for Disease Control and Prevention, and National Center for Health Statistics
Credit: Youyou Zhou; Sources: Centers for Disease Control and Prevention, National Center for Health Statistics
HAVE YOU LOST YOUR HARD EARNED FUNDS TO THE WRONG HANDS? MEET THE PROFESSIONAL HACKERS FOR HIRE TODAY. ⏱️ 3min Read 📁 Hiring a professional hacker has been one of the world's most technical valued navigating information. Regarding: •Recovery Of Lost Funds, •Mobile Phone Hack.(Catching A Cheating Spouse). •Credit Score Upgrade, VARIOUS HACKTIVITIES via leroysteckler@gmail.com High prolific information and Priviledges comes rare as it has been understood that what people do not see, they will never know. The affirmative ability to convey a profitable information Systematically is the majoy factor to success. Welcome to the Global KOS hacking agency where every request on hacking related issues are fixed within a short period of time. When you wonder “which hacking company should I hire, the first aspect that should concern you is Sincerity. Secondly, Rapid response. Clearly, you want to embark for services that povides swift response, With our astonishing Hackers, you will be glad to find out that our services Implies precision and action. This post is definitely for those who are willing to turn their lives around for the better, either financial-wise, relationship-wise or businesses. The manual Operation of this hackers is to potentially deploy a distinguished hacking techniques to penetrating computers. If your shoe fits in any of the services below, you will be assigned to a designated professional hacker who is systematically known for operating on a dark web V-link protocol. Providing value added services to clients as a hacker has been our sustaining goal. Are you faced with cyber challenges like 💰Recovery of lost funds:✅(BITCOIN INVESTMENTS, BINARY OPTIONS, LOAN AND TRADING FOREX WITH FORGERY BROKERS.) 🖥️I would try my possible best to shortly explain this in particular. This shocking study points to one harsh reality we all face today. It saddens our mind when client expresses annoyance or dissatisfaction of unethical behaviours of scammers. We have striven to make tenacious efforts to help those who are victims of this flees get off their traumatic feeling of loss. The cyber security technique used to retrieving back the victims stolen funds is the application of a diverse intercall XX breacher software enables you track the data location of a scammer. Extracting every informations on the con database. Every information required by the Global KOS would be used to tracking every transaction, time and location of the scammer. This is acheived using the systematic courier tracking base method• However, there are secret cyber infiltrators called brokers and doom. The particular system used by this scammers permeates them to manupulate targets digital trading system or monetary fund based accounts. Strictly using a dark web rob to diverting successful trades into a negative outcome. This process bends to thier advantage while investors results to losing massive amount of money. An act of gaining access to an organization or databased system to cause damages. We have worked so hard to ensure our services gives you a 100% trading success to recover all your losses• 📲 HACKING A MOBILE PHONE:.✅ Do you think you are being cheated on? Curious to know what your lover is up to online? This type of hack helps you track every movement of your cheater as we are bent on helping you gain full remote access into the cheater's mobile phone using a Trojan breach cracking system to penetrate their social media platforms like Facebook, whatsapp, snapchat etc. The company is large enough to provide comprehensive range of services such as• • Email hacks📲 • Hacking of websites.📲 • Uber free payment hacks.📲 Our strength is based on the ability to help fix cyber problems by bringing together active cyber hacking professionals in the GlobalkOS to work with. Contact: ✉️Email: theglobalkos@gmail.com Leroysteckler@gmail.com ®Global KOS™ 2020.
As a Partner and Co-Founder of Predictiv and PredictivAsia, Jon specializes in management performance and organizational effectiveness for both domestic and international clients. He is an editor and author whose works include Invisible Advantage: How Intangilbles are Driving Business Performance. Learn more...


1 comments:
HAVE YOU LOST YOUR HARD EARNED FUNDS TO THE WRONG HANDS?
MEET THE PROFESSIONAL HACKERS FOR HIRE TODAY.
⏱️ 3min Read
📁 Hiring a professional hacker has been one of the world's most technical valued navigating information.
Regarding:
•Recovery Of Lost Funds,
•Mobile Phone Hack.(Catching A Cheating Spouse).
•Credit Score Upgrade,
VARIOUS HACKTIVITIES via
leroysteckler@gmail.com
High prolific information and Priviledges comes rare as it has been understood that what people do not see, they will never know. The affirmative ability to convey a profitable information Systematically is the majoy factor to success.
Welcome to the Global KOS hacking agency where every request on hacking related issues are fixed within a short period of time.
When you wonder “which hacking company should I hire, the first aspect that should concern you is Sincerity. Secondly, Rapid response. Clearly, you want to embark for services that povides swift response, With our astonishing Hackers, you will be glad to find out that our services Implies precision and action.
This post is definitely for those who are willing to turn their lives around for the better, either financial-wise, relationship-wise or businesses.
The manual Operation of this hackers is to potentially deploy a distinguished hacking techniques to penetrating computers.
If your shoe fits in any of the services below, you will be assigned to a designated professional hacker who is systematically known for operating on a dark web V-link protocol.
Providing value added services to clients as a hacker has been our sustaining goal.
Are you faced with cyber challenges like
💰Recovery of lost funds:✅(BITCOIN INVESTMENTS, BINARY OPTIONS, LOAN AND TRADING FOREX WITH FORGERY BROKERS.) 🖥️I would try my possible best to shortly explain this in particular.
This shocking study points to one harsh reality we all face today. It saddens our mind when client expresses annoyance or dissatisfaction of unethical behaviours of scammers. We have striven to make tenacious efforts to help those who are victims of this flees get off their traumatic feeling of loss. The cyber security technique used to retrieving back the victims stolen funds is the application of a diverse intercall XX breacher software enables you track the data location of a scammer. Extracting every informations on the con database. Every information required by the Global KOS would be used to tracking every transaction, time and location of the scammer. This is acheived using the systematic courier tracking base method•
However, there are secret cyber infiltrators called brokers and doom. The particular system used by this scammers permeates them to manupulate targets digital trading system or monetary fund based accounts. Strictly using a dark web rob to diverting successful trades into a negative outcome. This process bends to thier advantage while investors results to losing massive amount of money. An act of gaining access to an organization or databased system to cause damages. We have worked so hard to ensure our services gives you a 100% trading success to recover all your losses•
📲 HACKING A MOBILE PHONE:.✅ Do you think you are being cheated on? Curious to know what your lover is up to online? This type of hack helps you track every movement of your cheater as we are bent on helping you gain full remote access into the cheater's mobile phone using a Trojan breach cracking system to penetrate their social media platforms like Facebook, whatsapp, snapchat etc.
The company is large enough to provide comprehensive range of services such as•
• Email hacks📲
• Hacking of websites.📲
• Uber free payment hacks.📲
Our strength is based on the ability to help fix cyber problems by bringing together active cyber hacking professionals in the GlobalkOS to work with.
Contact:
✉️Email: theglobalkos@gmail.com
Leroysteckler@gmail.com
®Global KOS™
2020.
Post a Comment